29 April 2021
TUFLOW FV’s GPU Engine is redefining our approach to flexible mesh modelling and what we can achieve for project delivery. Models that previously took weeks to run can now be run in less than a day, and those that ran for days can now be run in minutes. What’s the catch? Well the truth is there isn’t one, our goal is to make our software one of the fastest available without compromising on scientific accuracy.
This insight article explores recent TUFLOW FV speed benchmarking completed here at TUFLOW. We showcase the speed increases currently achievable with parallel CPU and GPU computing for both local workstation and cloud computing. With speed increases exceeding 100x single core CPU, the results presented herein demonstrate that TUFLOW’s code has been efficiently designed to excel and make use of the latest hardware on offer.
Although our testing shows multi-core CPU results demonstrate useful acceleration, the relative performance of GPUs over CPUs appears to be significant and larger now than ever before.
Although our testing shows multi-core CPU results also demonstrate useful acceleration, the relative performance of GPUs over CPUs appears to be significant and larger now than ever before.
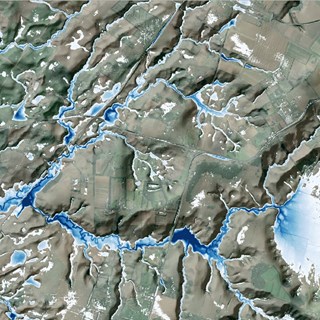
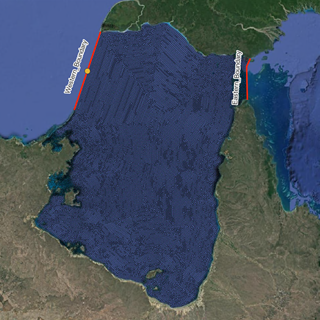
Benchmarking was completed for a real estuary system (based on TUFLOW FV’s Tutorial Module 05) as shown in the central panel of Figure 1.
A series of four scenarios of increasing feature complexity were simulated on five meshes with increasing spatial resolution. A zoomed in shot of each higher resolution mesh are shown via the four insets in Figure 1. The five meshes considered had cell counts ranging from 1,375 to 352,000 2D cells and 6,453 to 1,659,745 3D cells (refer Table 1). For each cell resolution and scenario, eight different hardware configurations were considered: single core CPU; multi-core CPU; and several GPU card types. The selected hardware comprised a combination of compute sourced either through local office computers, Microsoft Azure or Amazon Web Services. The various hardware types are further described in Table 2.
The four scenarios included: a 2D hydrodynamics only simulation; a 3D hydrodynamic simulation; a 3D hydrodynamic simulation with sediment transport and a 3D simulation with sediment transport and water quality (refer Table 3 ).
Note that the simulations were run with single precision computation for both CPUs and GPUs. TUFLOW FV utilises an explicit finite volume scheme for which stability and conservation are both easily achieved with single precision computation. The exception to this is water quality calculations that are conducted in double precision; however these computations are completed on a larger time interval and CPU only.
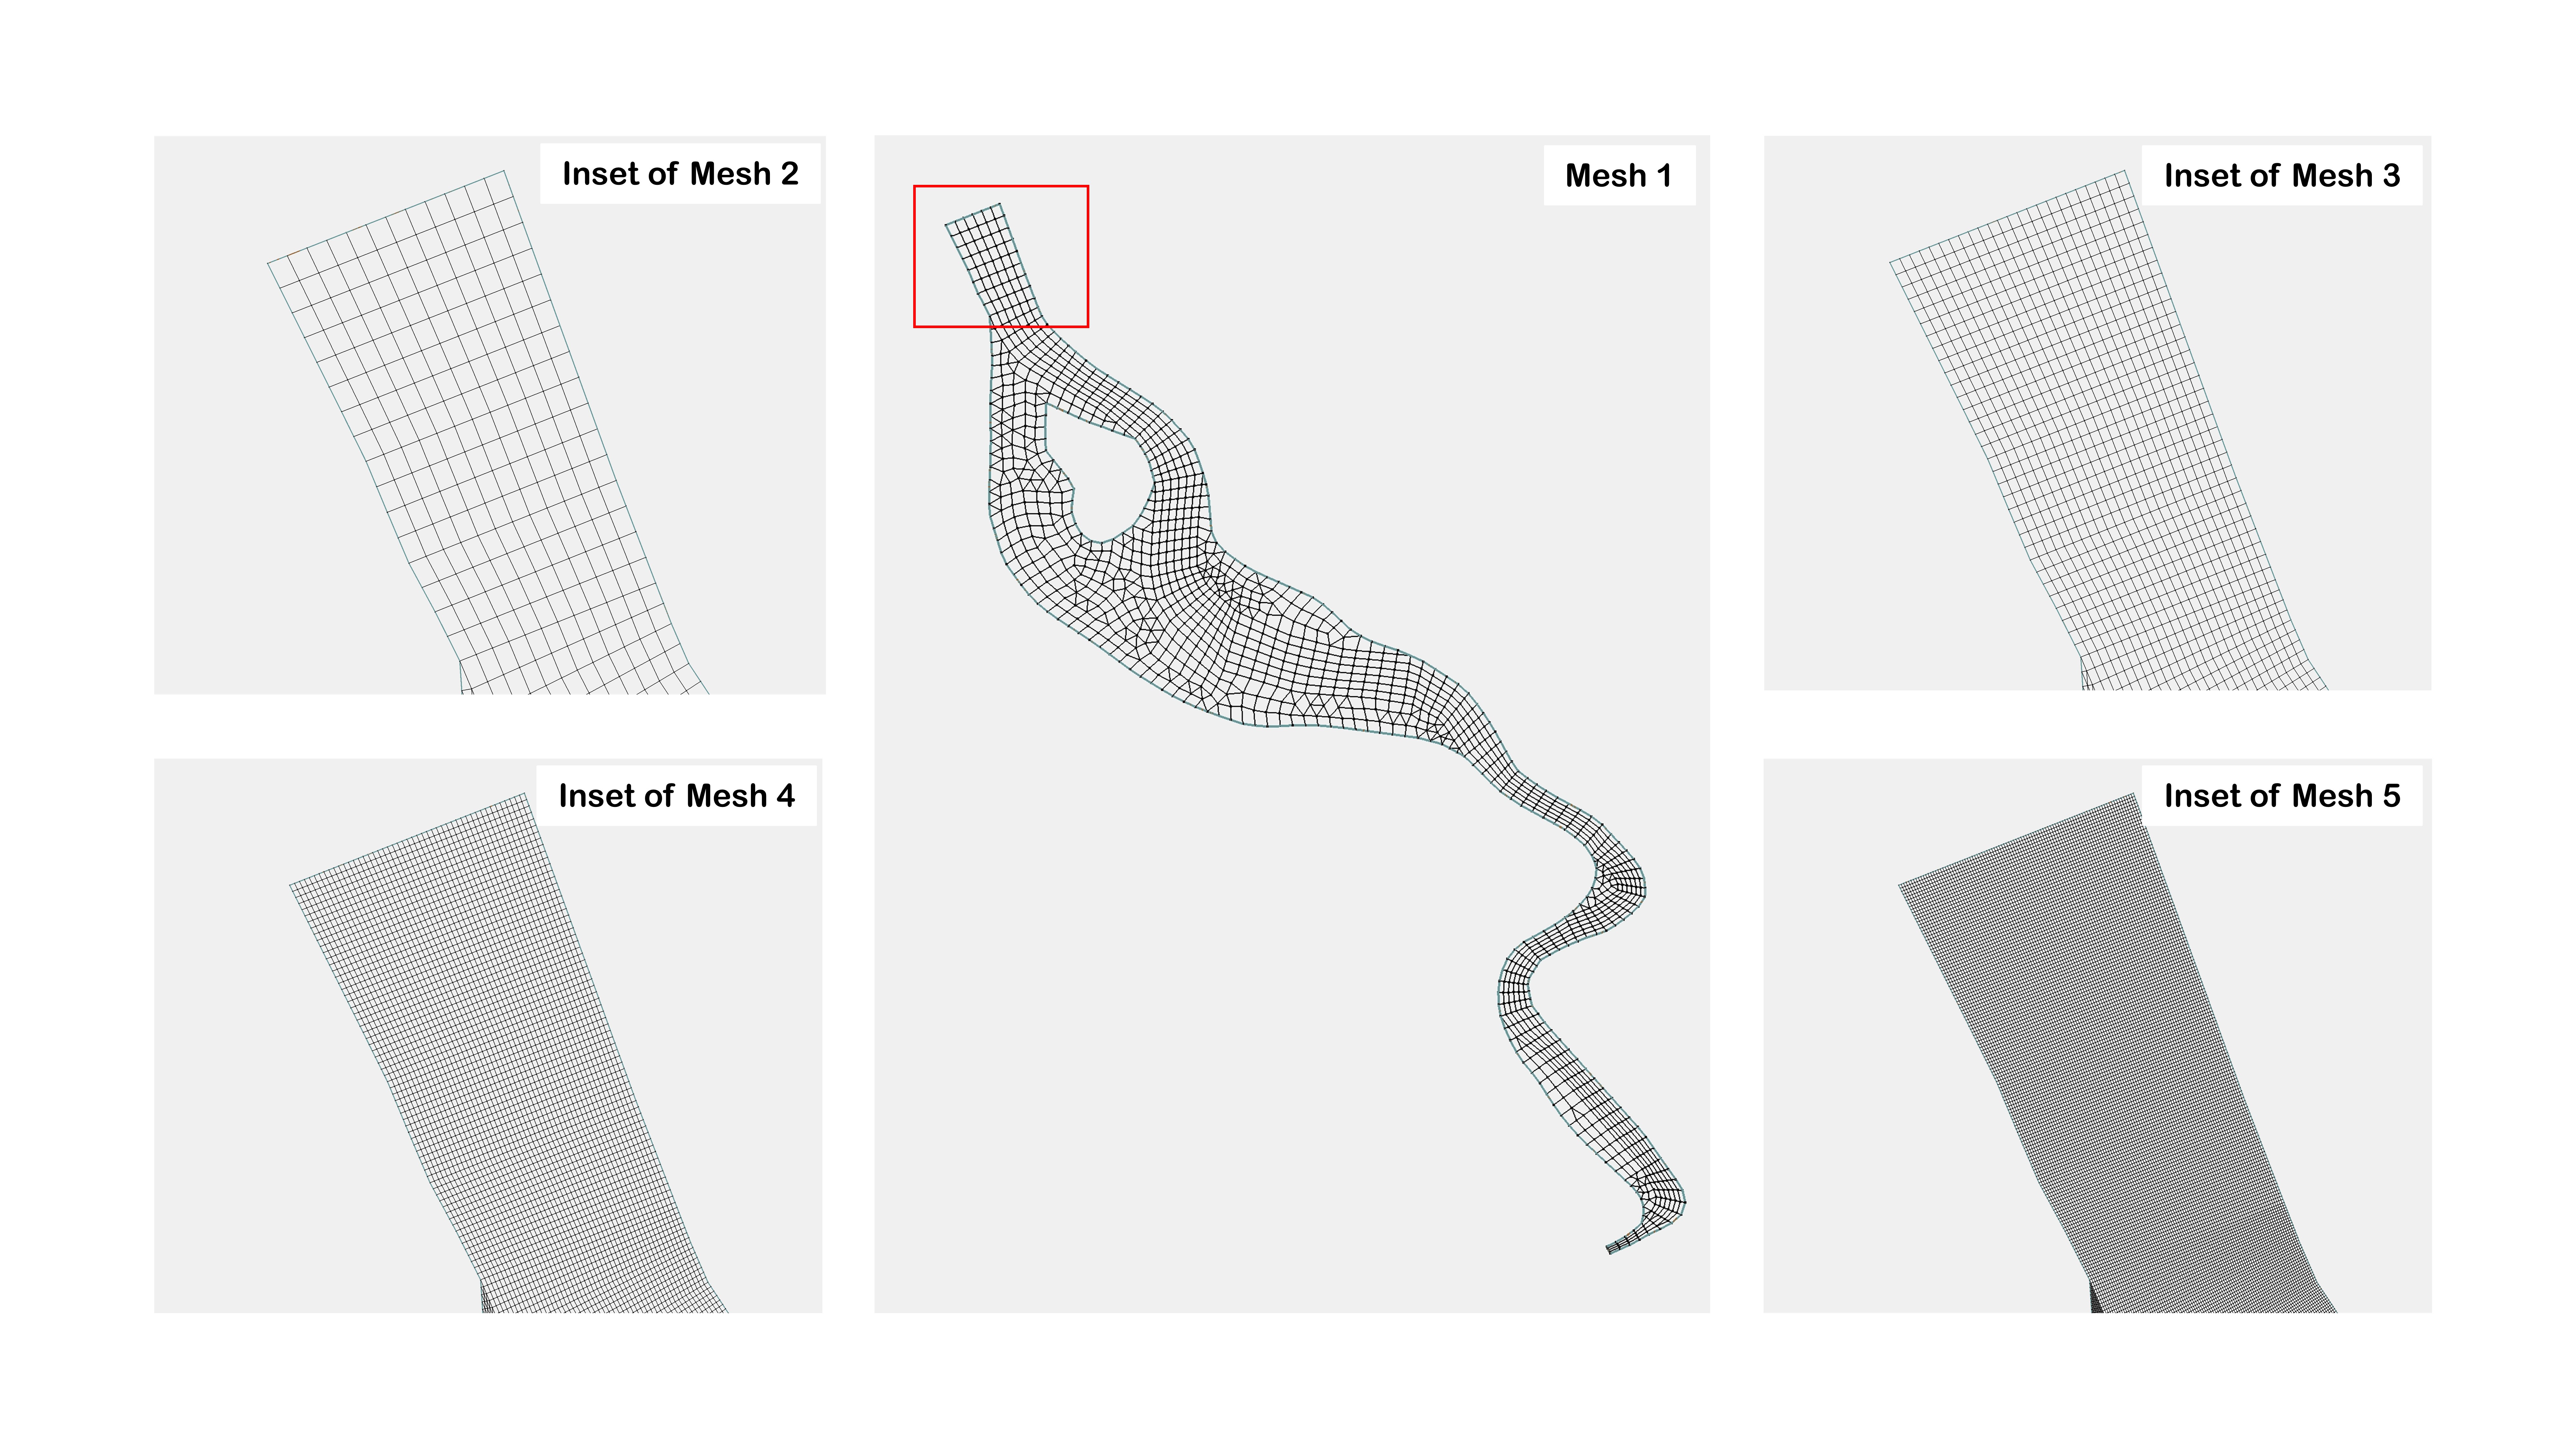
Figure 1 Estuary model mesh (centre) and four insets showing the increasingly high cell resolutions used for testing.
Table 1 – Model Mesh 2D and 3D Cell Counts
| Mesh 1D | Number of 2D Cells | Number of 3D Cells |
|
Mesh 1 |
1,375 |
6,453 |
|
Mesh 2 |
5,500 |
25,877 |
|
Mesh 3 |
22,000 |
103,690 |
|
Mesh 4 |
88,000 |
414,875 |
|
Mesh 5 |
352,000 |
1,659,745 |
Table 2 - Summary of CPU and GPU Hardware Used for Speed Benchmark Testing
| Title | Hardware | Type | Environment |
|
Single Core CPU |
Intel® Xeon® Platinum 8272CL (Cascade Lake) Run using OMP_NUM_THREADS=1 |
CPU |
Cloud Microsoft Azure F16s_v2 |
|
16 Core CPU |
Intel® Xeon® Platinum 8272CL (Cascade Lake) Run using OMP_NUM_THREADS=16 |
CPU |
Cloud Microsoft Azure F16s_v2 |
|
Tesla K80 |
GPU |
Cloud Microsoft Azure NC6 |
|
|
Tesla T4 |
|
GPU |
Cloud Amazon Web Services EC2 G4 |
|
TITAN |
GPU |
Office Workstation |
|
|
GTX 2080 |
GPU |
Office Workstation |
|
|
RTX 3090 |
GPU |
Office Workstation |
|
|
Tesla V100 |
GPU |
Cloud Microsoft Azure NC6_v3 |
Table 3 Benchmark Model Scenarios
| Model Scenario | Details |
|
2D Hydrodynamic |
2D hydrodynamic only. No temperature, salinity or water quality constituents. |
|
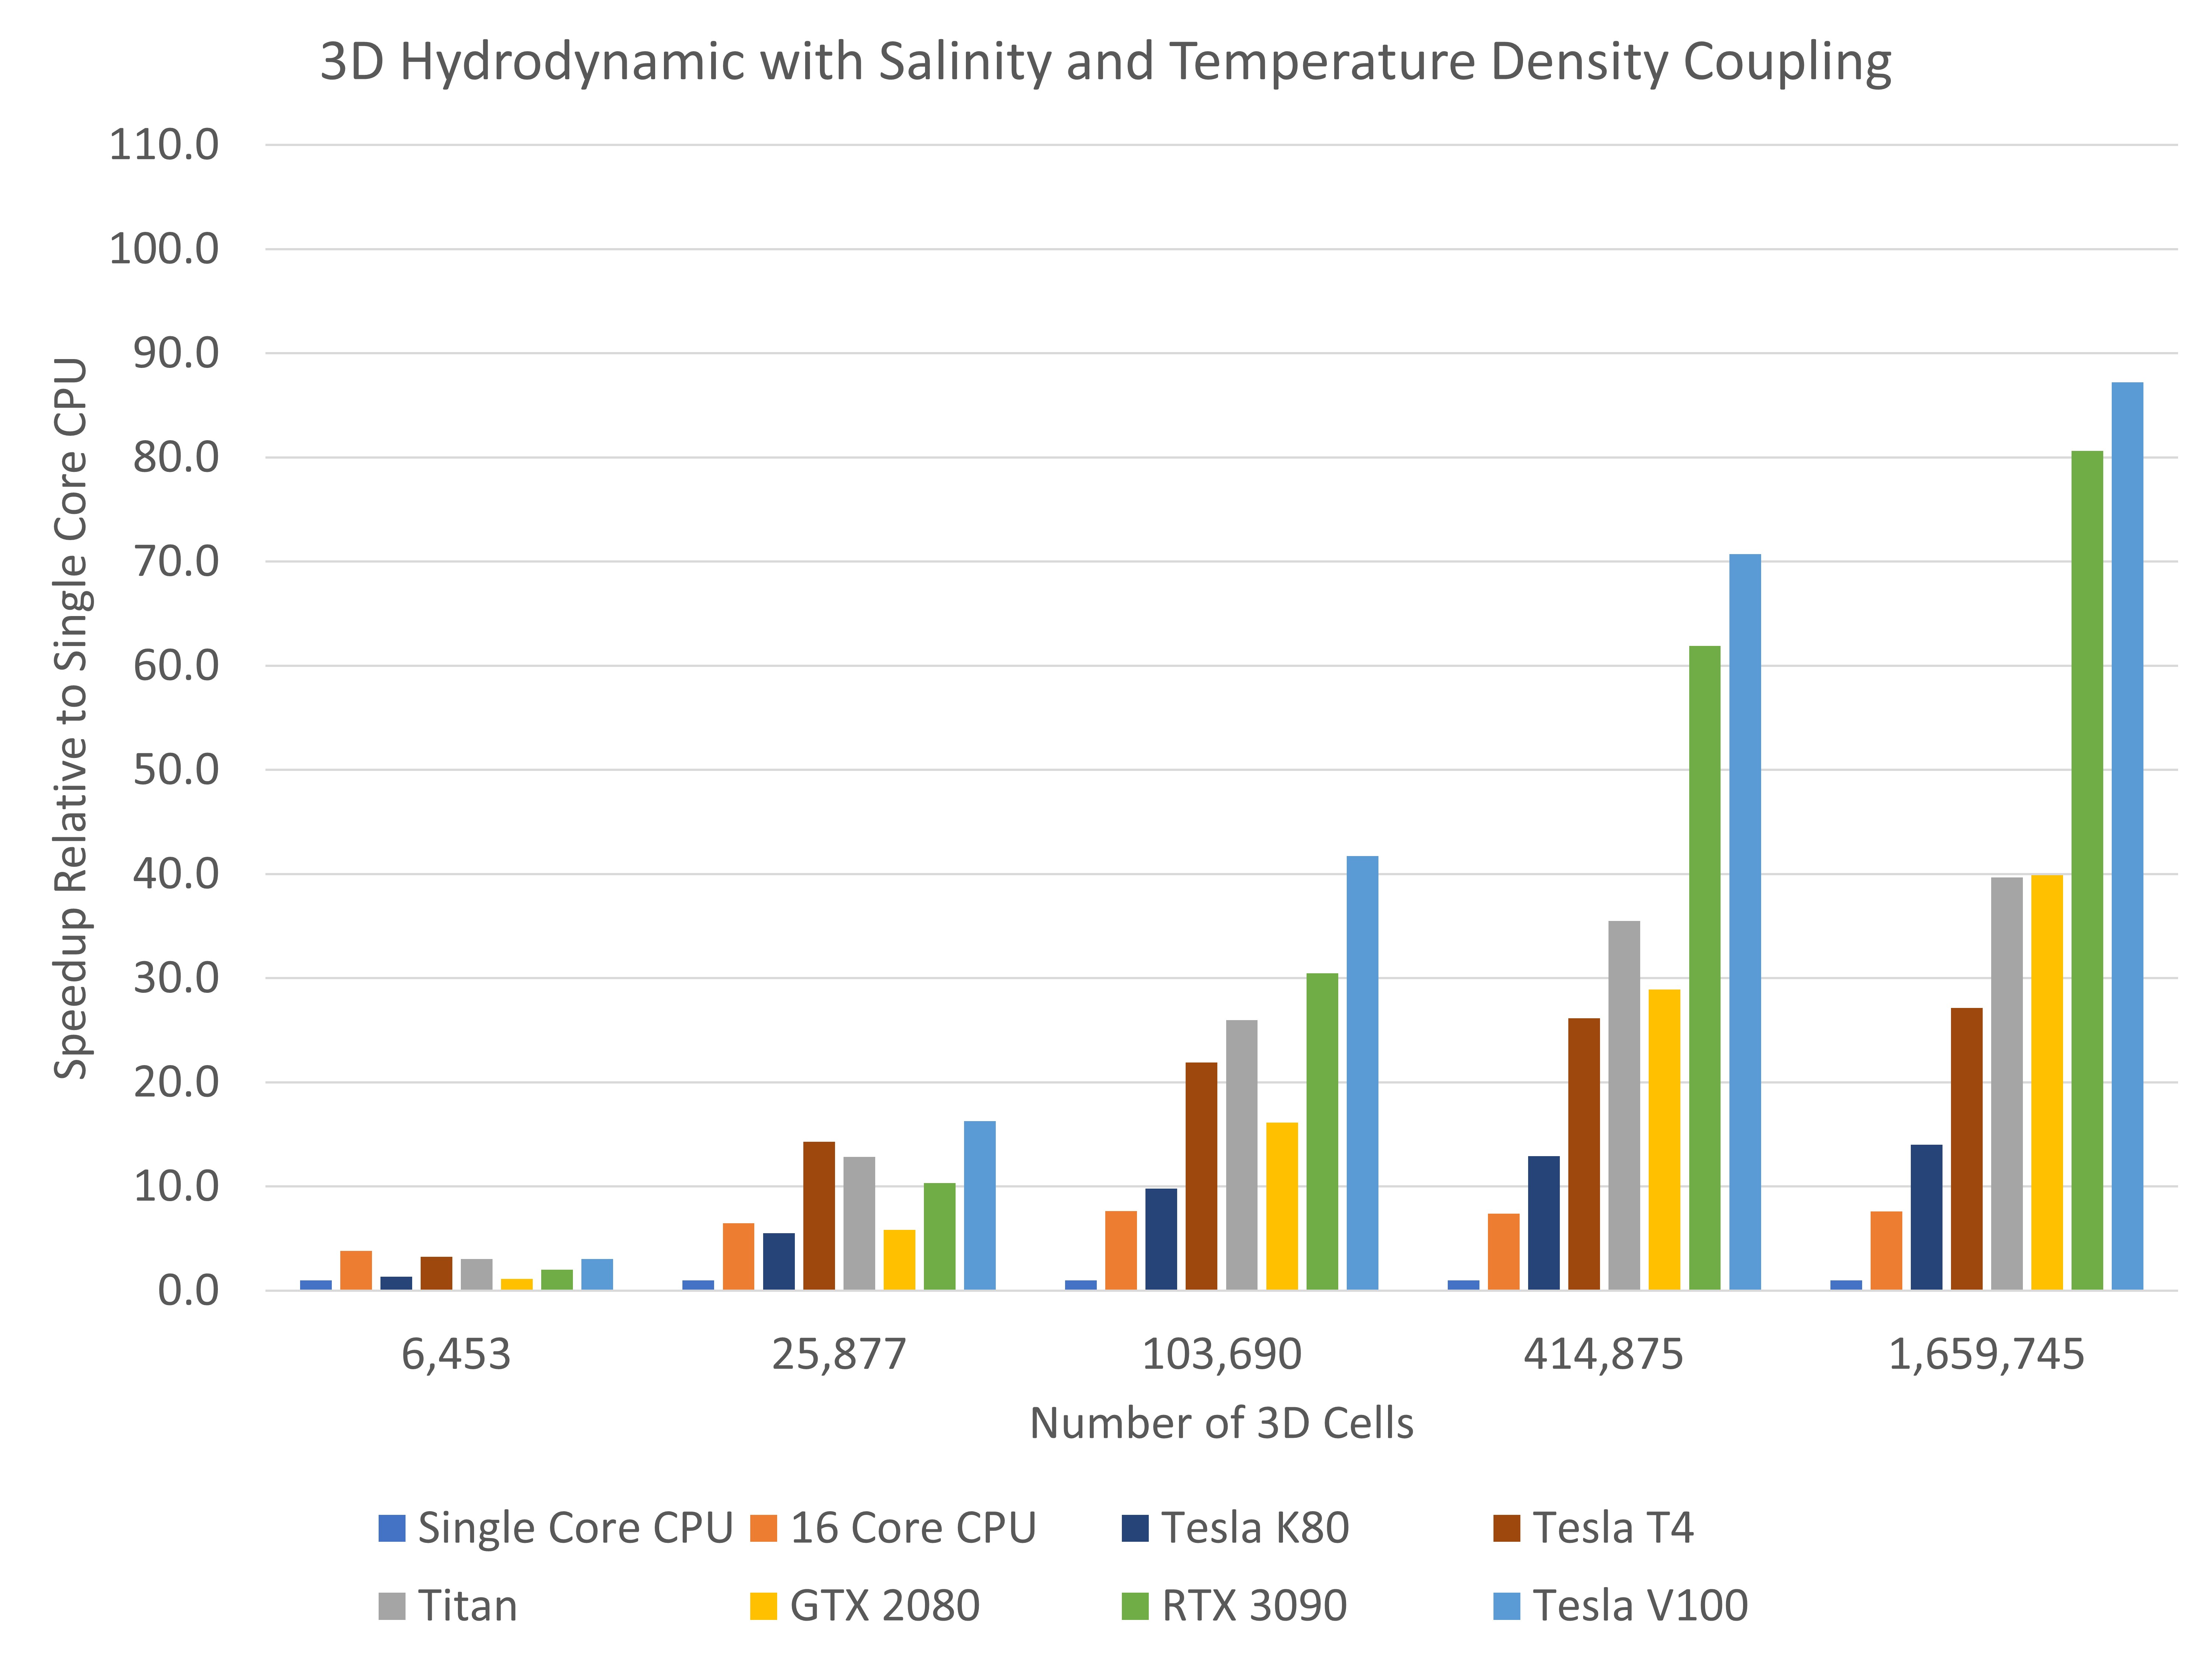
3D Hydrodynamic with Temperature and Salinity Density Coupling |
3D model with hybrid z-sigma vertical layering. Temperature, heat module and salinity enabled with density coupling. No sediment transport or water quality. |
|
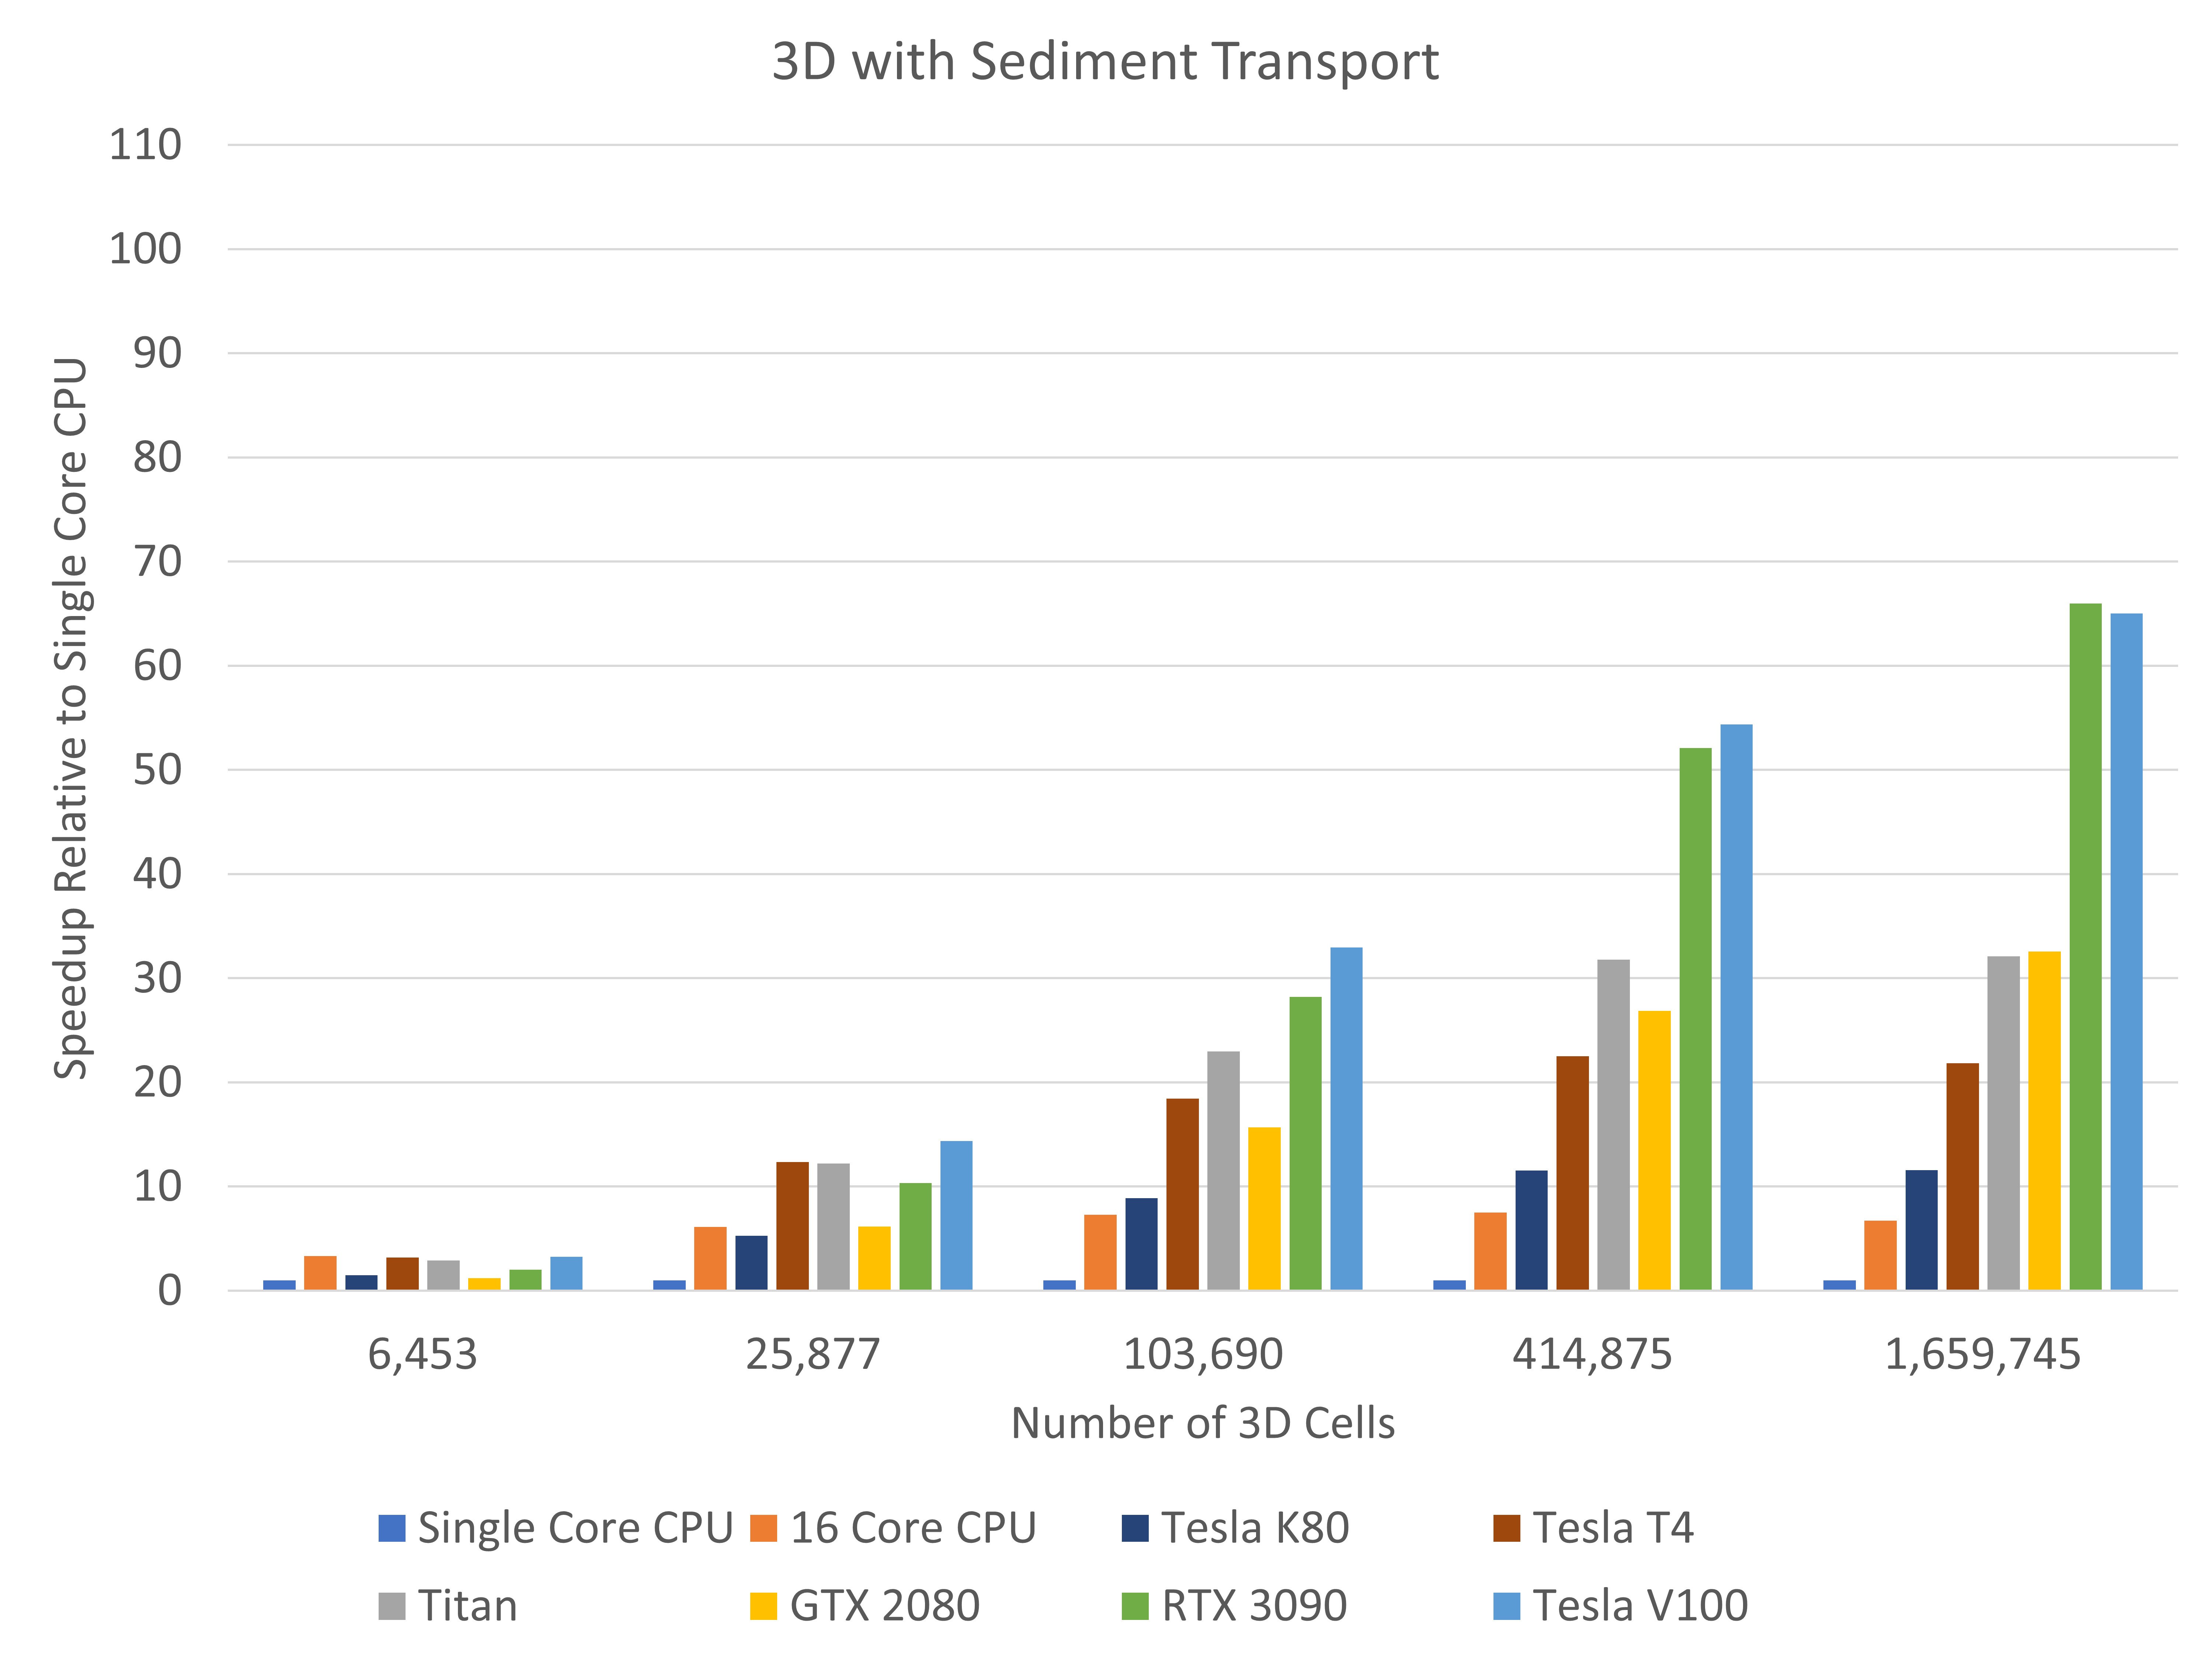
3D as above with the addition of with Sediment Transport |
3D model with hybrid z-sigma vertical layering. Temperature, heat module and salinity enabled with density coupling. Two sediment fractions enabled, silt and sand. No water quality. |
|
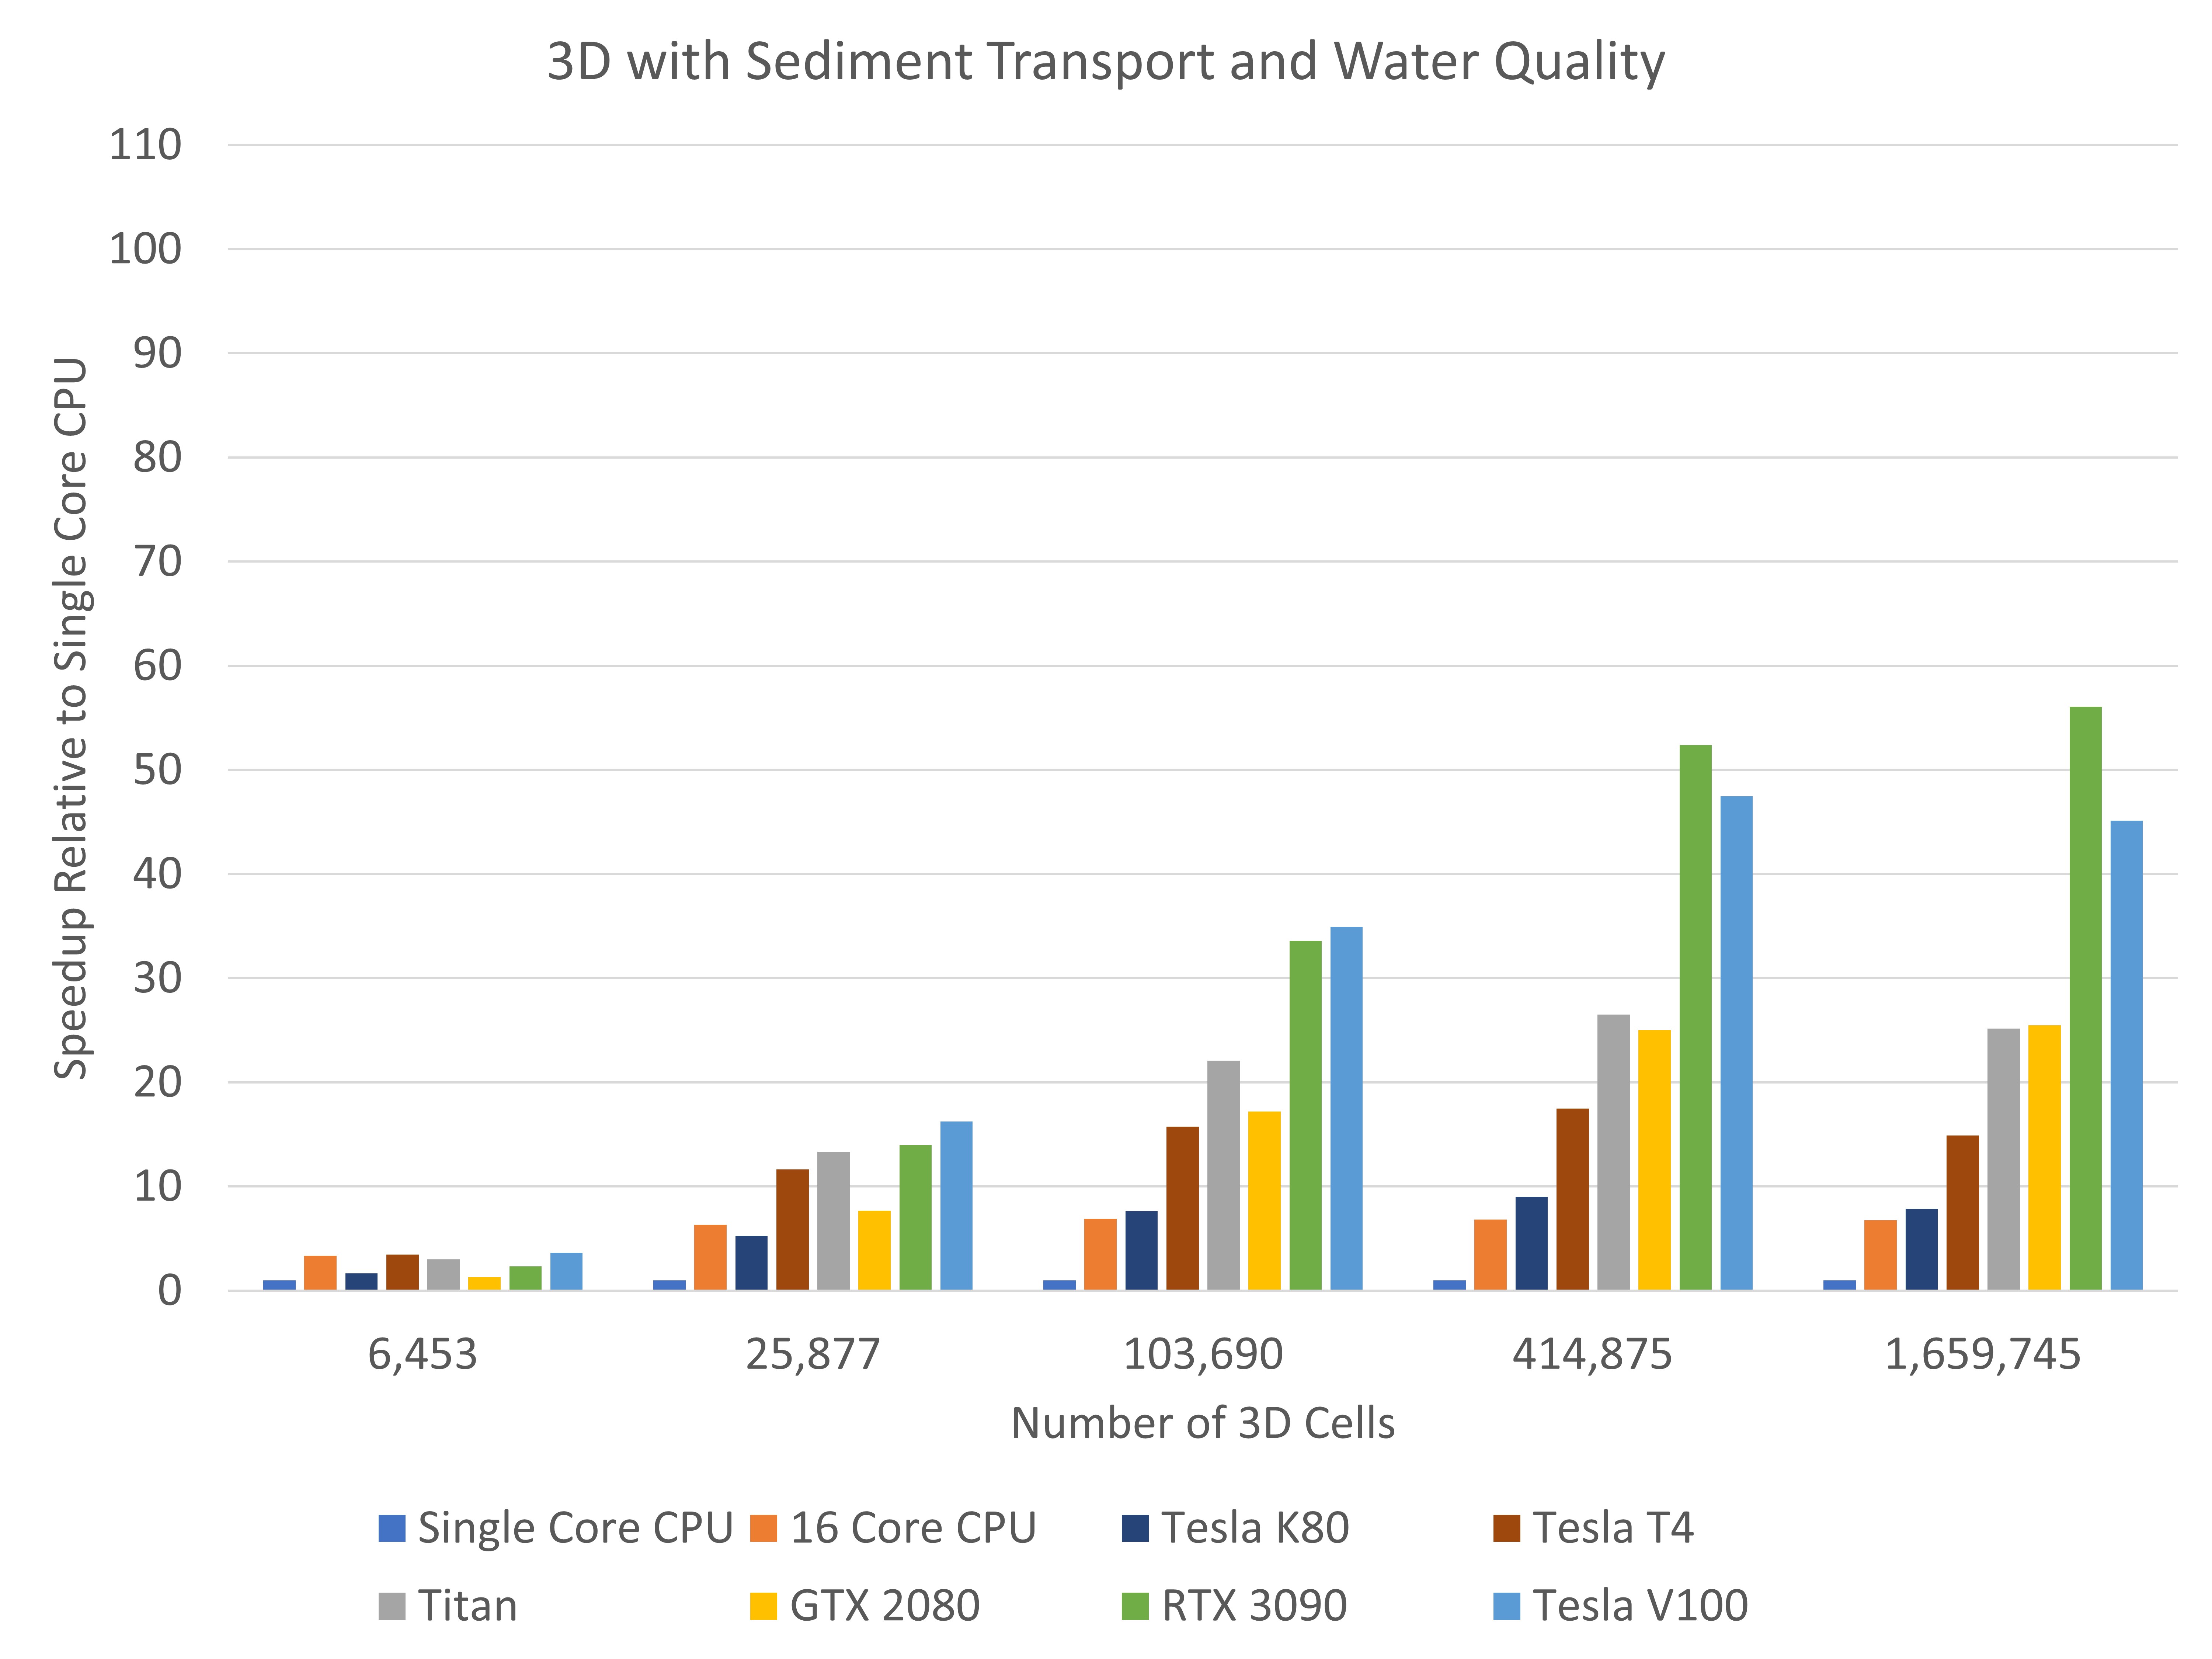
3D as above with the addition of both Sediment Transport and Water Quality |
3D model with hybrid z-sigma vertical layering. Temperature, heat module and salinity enabled with density coupling. Two sediment fractions enabled, silt and sand. Thirteen water quality constituents required to model dissolved oxygen, inorganic and organic nutrients, and one algal species. Note the Water Quality computations are executed with a larger time interval and are performed strictly on CPU. |
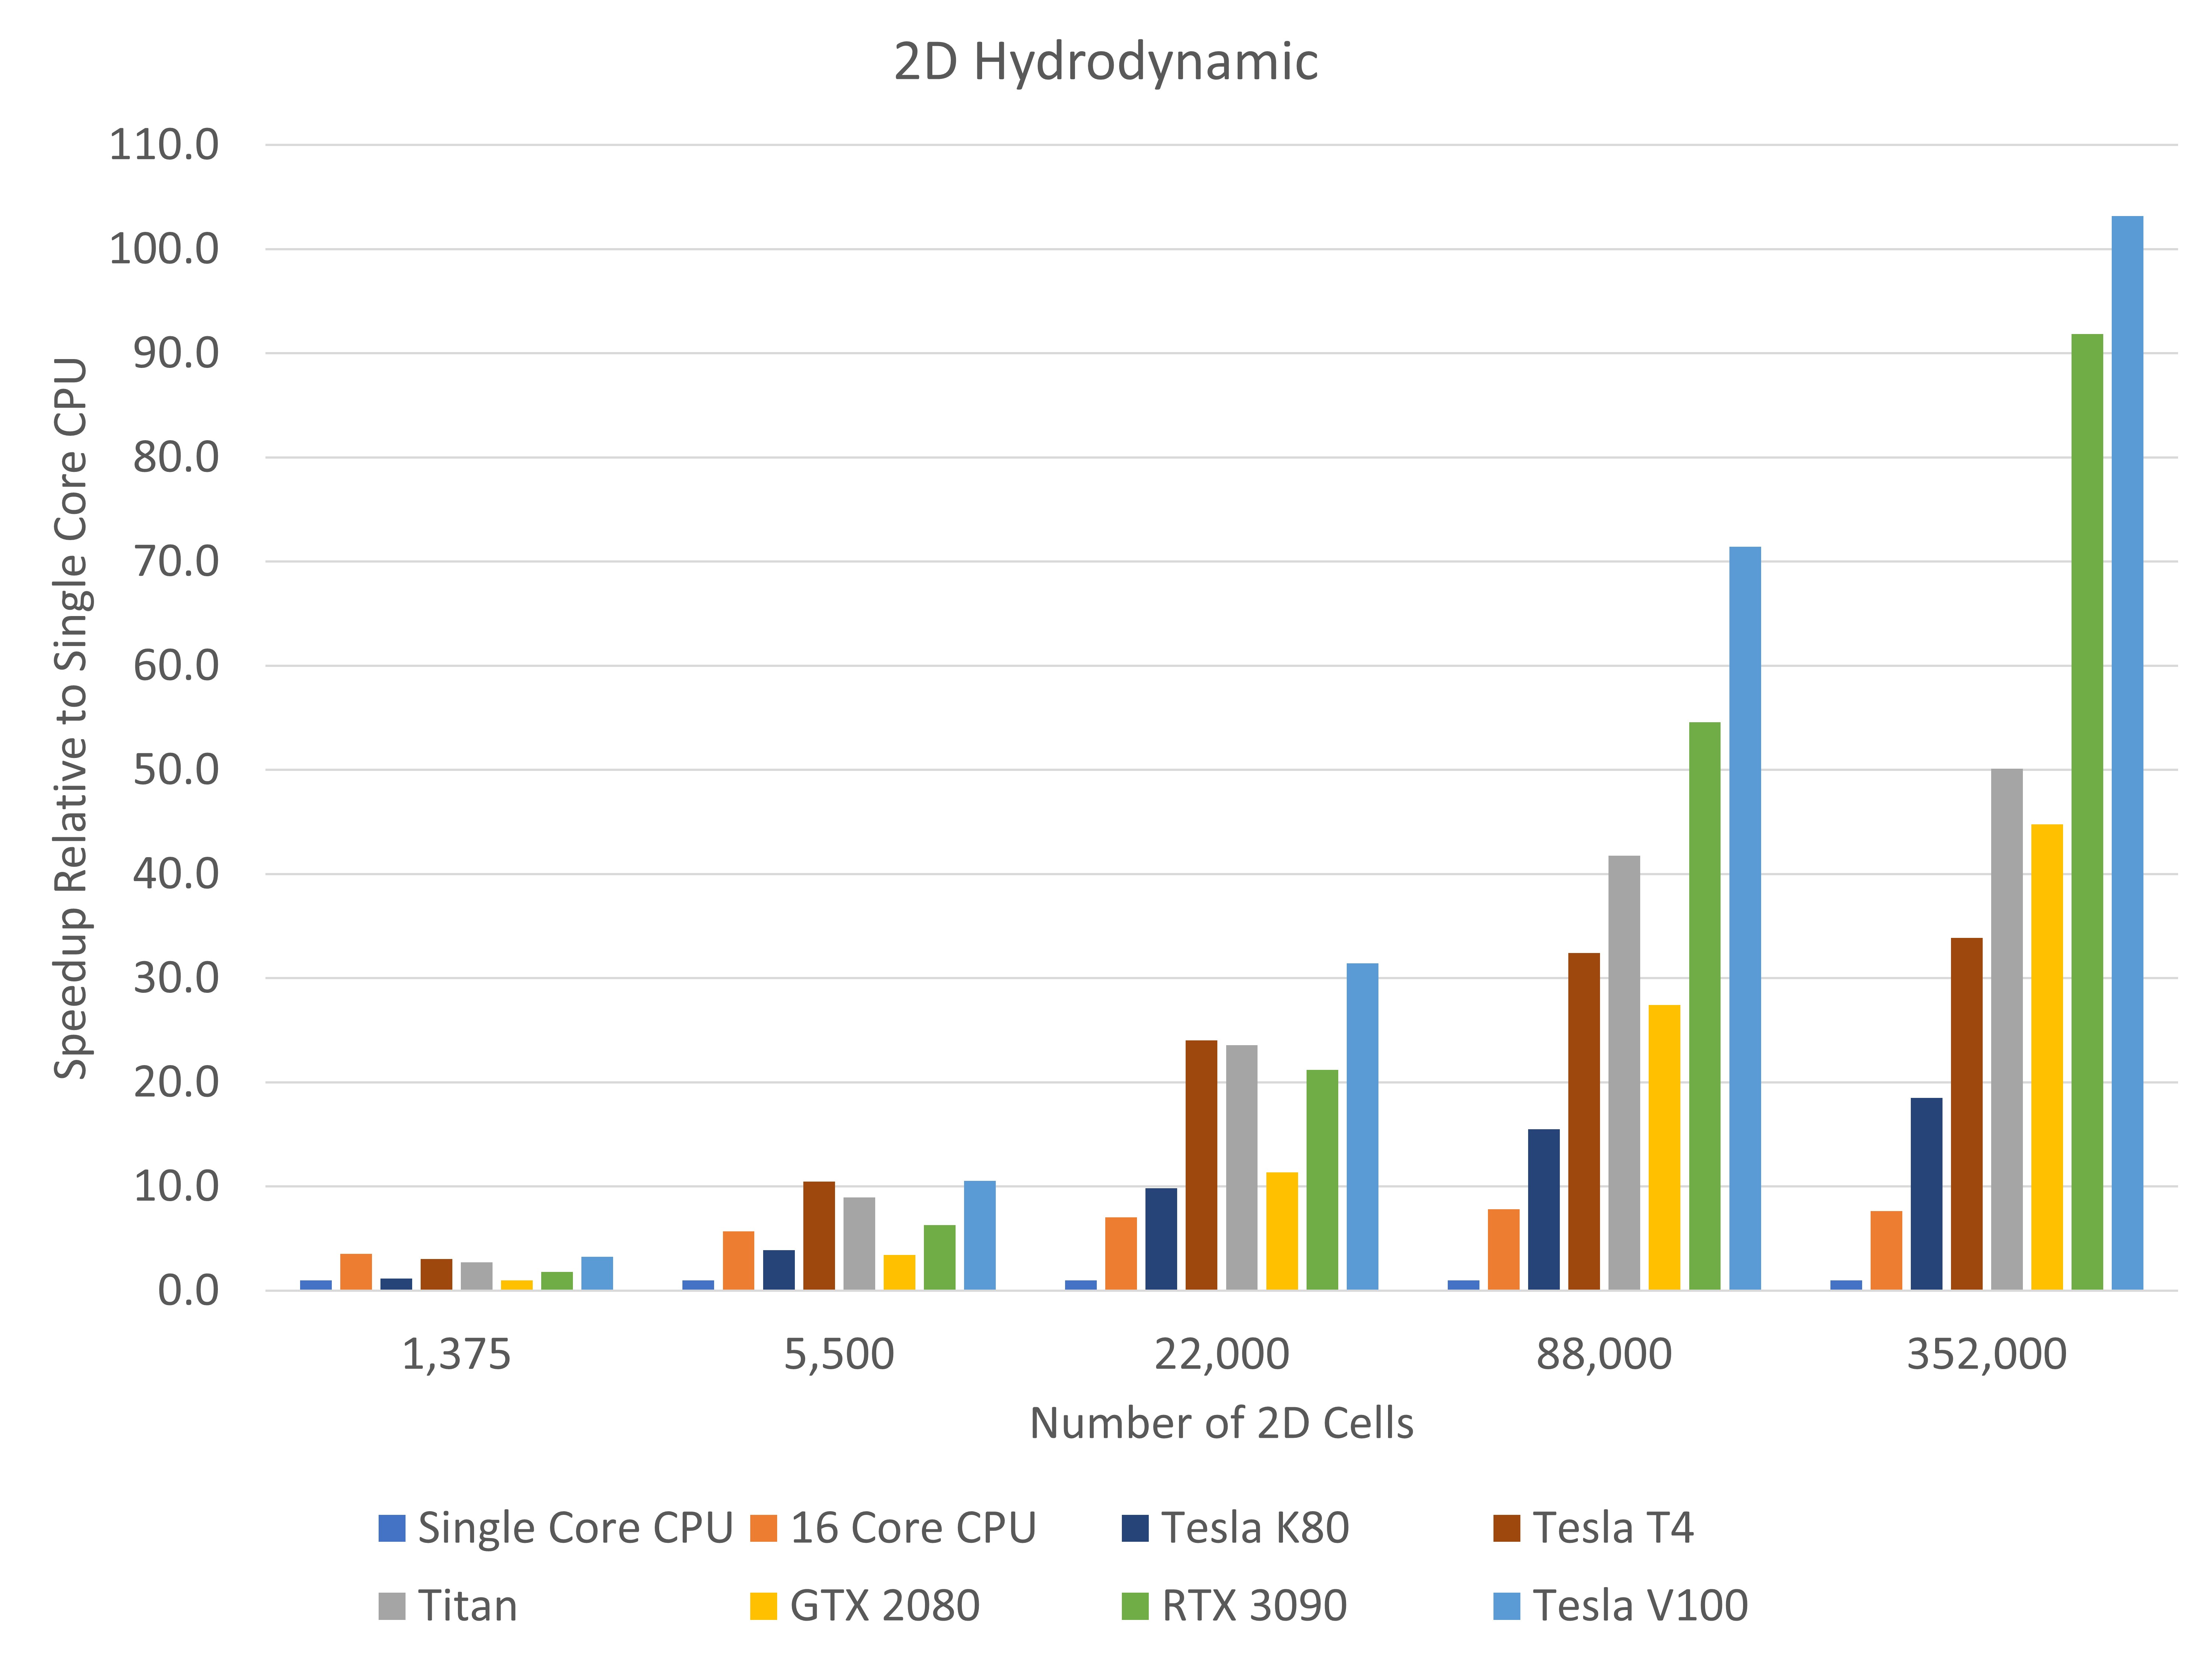
For each scenario, results are presented in the form of relative speed ups compared to running on Single Core CPU. This means that the results presented for the single core CPU will always have a value of 1.0. For example, if a model takes 1hr to run on Single Core CPU and 0.25 hrs on the NVIDIA Telsa K80, the NVIDIA Tesla K80 achieves a speedup of 4.0x Single Core CPU. An example graphic (refer Figure 2) is provided to assist in interpreting the respective scenarios results.
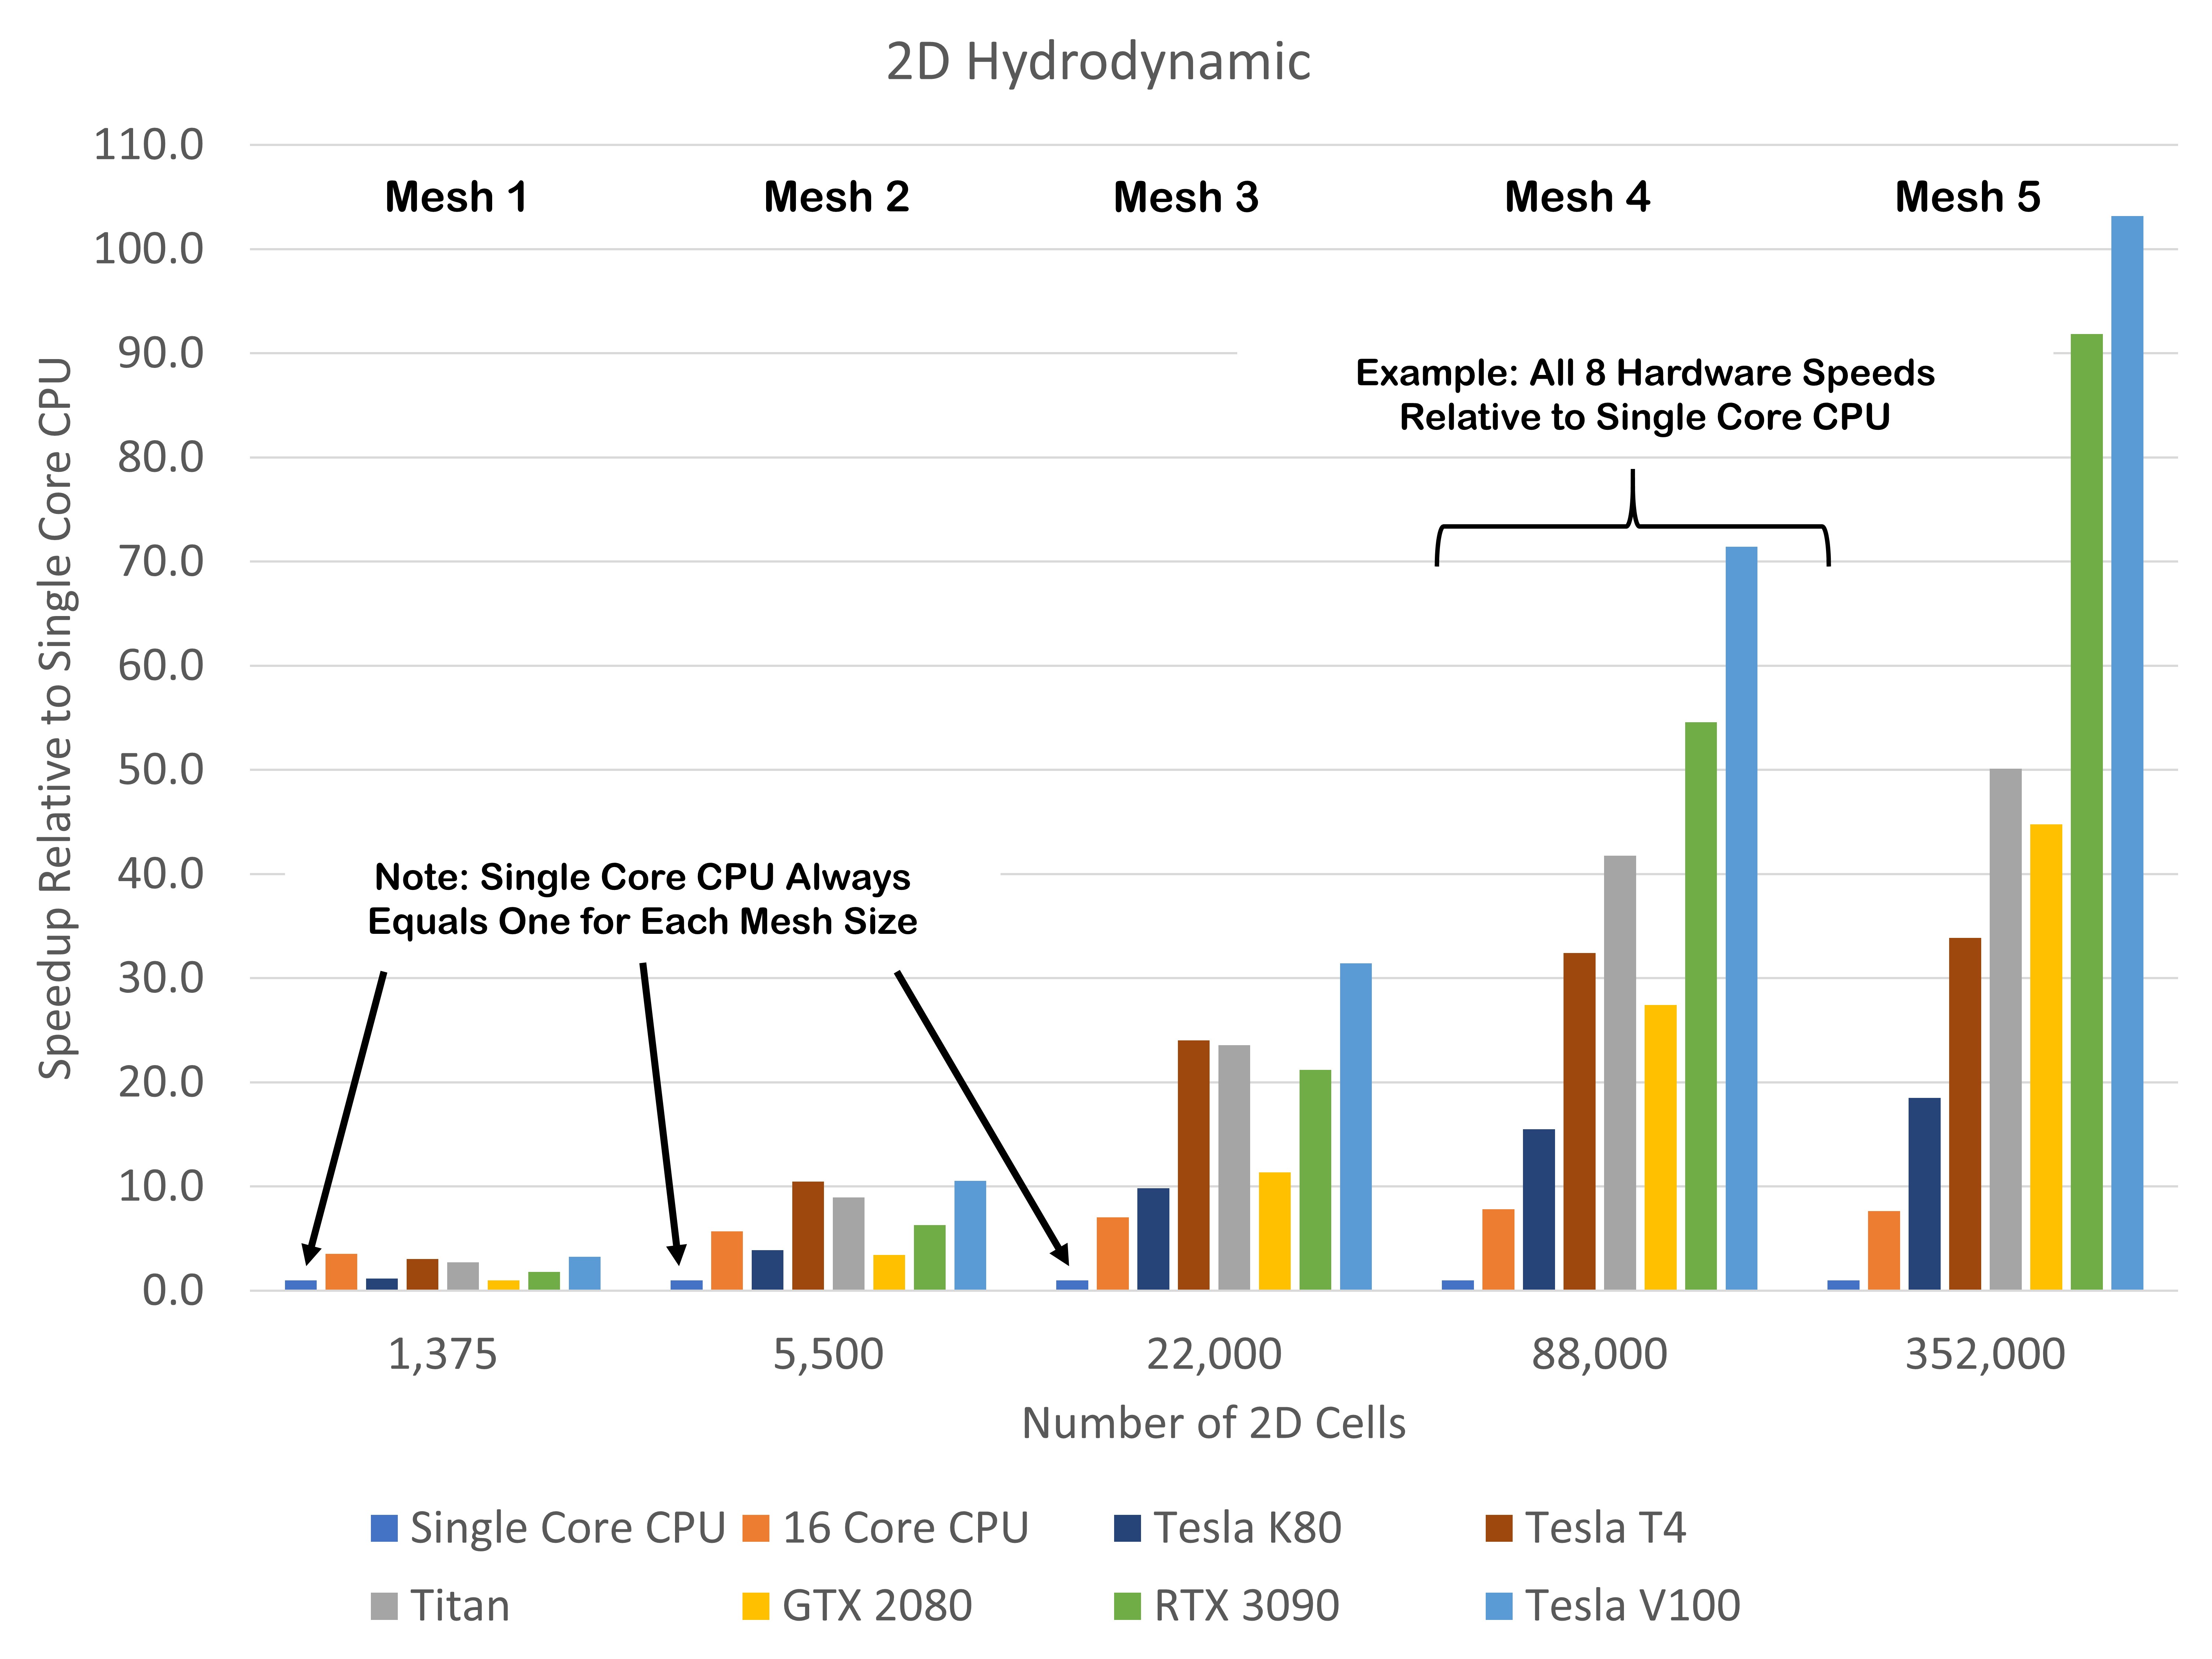
Figure 2 – Example Relative Scaling Graphic
| Single Core CPU | 16 Core CPU | Tesla K80 | Tesla T4 | Titan | GTX 2080 | RTX 3090 | Tesla V100 |
|
1.0 |
3.5 |
1.2 |
3.1 |
2.7 |
1.0 |
1.8 |
3.3 |
|
1.0 |
5.7 |
3.9 |
10.5 |
9.0 |
3.4 |
6.3 |
10.5 |
|
1.0 |
7.0 |
9.8 |
24.0 |
23.6 |
11.4 |
21.2 |
31.4 |
|
1.0 |
7.8 |
15.5 |
32.4 |
41.8 |
27.4 |
54.6 |
71.4 |
|
1.0 |
7.7 |
18.5 |
33.9 |
50.1 |
44.8 |
91.9 |
103.2 |
| Single Core CPU | 16 Core CPU | Tesla K80 | Tesla T4 | Titan | GTX 2080 | RTX 3090 | Tesla V100 |
|
1.0 |
3.8 |
1.3 |
3.3 |
3.0 |
1.1 |
2.0 |
3.0 |
|
1.0 |
6.5 |
5.5 |
14.3 |
12.9 |
5.8 |
10.3 |
16.3 |
|
1.0 |
7.7 |
9.8 |
21.9 |
26.0 |
16.1 |
30.5 |
41.7 |
|
1.0 |
7.4 |
12.9 |
26.2 |
35.5 |
28.9 |
61.9 |
70.7 |
|
1.0 |
7.6 |
14.0 |
27.2 |
39.7 |
39.9 |
80.6 |
87.2 |
| Single Core CPU | 16 Core CPU | Tesla K80 | Tesla T4 | Titan | GTX 2080 | RTX 3090 | Tesla V100 |
|
1.0 |
3.3 |
1.5 |
3.2 |
2.9 |
1.2 |
2.0 |
3.3 |
|
1.0 |
6.1 |
5.3 |
12.4 |
12.2 |
6.1 |
10.3 |
14.4 |
|
1.0 |
7.3 |
8.9 |
18.5 |
23.0 |
15.7 |
28.2 |
33.0 |
|
1.0 |
7.5 |
11.6 |
22.5 |
31.8 |
26.9 |
52.1 |
54.4 |
|
1.0 |
6.7 |
11.6 |
21.8 |
32.1 |
32.6 |
66.0 |
65.0 |
| Single Core CPU | 16 Core CPU | Tesla K80 | Tesla T4 | Titan | GTX 2080 | RTX 3090 | Tesla V100 |
|
1.0 |
3.3 |
1.7 |
3.5 |
3.0 |
1.3 |
2.3 |
3.6 |
|
1.0 |
6.3 |
5.3 |
11.7 |
13.3 |
7.7 |
14.0 |
16.2 |
|
1.0 |
6.9 |
7.6 |
15.7 |
22.1 |
17.2 |
33.6 |
34.9 |
|
1.0 |
6.8 |
9.0 |
17.5 |
26.5 |
25.0 |
52.4 |
47.4 |
|
1.0 |
6.7 |
7.8 |
14.9 |
25.2 |
25.5 |
56.1 |
45.1 |
Parallel processing on 16 Core CPU currently allows for peak speed increases of 6 to 8 times faster compared to Single Core CPU (refer Table 4). Multi-core CPU accelerations are shown to be somewhat insensitive to the model scenario being simulated, at least for this benchmark model domain. This is consistent with other CPU benchmark tests completed to date by the TUFLOW development team.
Most interestingly is the excellent scaling achieved by both the Telsa V100 and GeForce RTX 3090 as the model size increases including multiplicative speed gains exceeded 100 times faster for larger 2D hydrodynamic simulations. It can also be seen that as model complexity is added, each scenario results in a slightly lower scaling factor. This is due to an increased fraction of the computation load being performed by the CPU – not all the code has been ported to GPU yet.
For CPU components of the code, for example vertical turbulence, water quality and some sediment transport routines, one of our current missions is to progressively move more of the compute to GPU or to improve the parallel CPU processing of these routines. With these improvements, over time we should see further improved scaling on both 2D models and more complex 3D model setups.
The benchmarking has showcased that runtime benefits can be gained running either locally on an office workstation or in modern Cloud environments such as Microsoft Azure and Amazon Web Services. As a consumer, the results show that comparable speed performance can be achieved on both retail graphics cards such as the GeForce RTX 3090 as well as high-end scientific grade cards such as the Telsa V100, with the latter being several times more expensive than the former. This is a particular feature of TUFLOW FV being able to utilise single precision computation (note that scientific grade cards significantly outperform the gaming cards for double precision compute applications).
Importantly, TUFLOW FV has proven that it can harness the computational power of modern GPUs under a range increasing complex modelling scenarios. This ability to increase speed with increasing model size for these test cases highlights that it is hardware - not software - that is limiting what is currently achievable on TUFLOW FV GPU.
Table 4 – Summary of Peak CPU and GPU Runtime Scaling Results
| Scenario | Peak 16 Core CPU Scaling | Peak GPU Scaling |
|
2D Hydrodynamic |
7.8 |
103.2 (Tesla V100) |
|
3D Hydrodynamic with Temperature and Salinity Density Coupling |
7.5 |
87.2 (Tesla V100) |
|
3D with Sediment Transport |
7.5 |
66.0 (GeForce RTX 3090) |
|
3D with Sediment Transport and Water Quality |
6.9 |
56.1 (GeForce RTX 3090) |
This testing has been completed on a single model domain only, albeit with differing resolutions and model setups. However, speed results are likely to vary depending on model domain. More testing is to be completed to gain a better understanding of scaling sensitivity to model domain.
These tests have been completed on a Windows Operating System. As TUFLOW FV is also Linux CPU and GPU enabled, further testing is to be completed comparing Windows and Linux runtimes.
TUFLOW are currently progressing testing of the GeForce RTX 3080 and new NVIDIA A100 series Cloud GPU systems. As these results become available this page will be updated. We also aim to test late generation AMD CPUs for multi-core scaling as we are aware of reports that these may outperform the Intel Xeon Platinum’s used in this testing.
The TUFLOW FV developers are currently completing CPU domain decomposition, which is likely to improve the 6 to 8 times scaling currently seen on 16 core and higher core number CPU compute. The inclusion of domain-decomposition will also allow multiple-GPU compute for a single simulation. The scaling across multiple GPUs will be a point of interest.
As further testing of CPU and GPU scaling under domain decomposition becomes available, we will publish similar insights to our website.
If you have any further queries regarding the benchmark testing or would like to know more about TUFLOW FV on GPU please contact Mitchell Smith via support@tuflow.com.

TUFLOW - Info
This insights article and associated presentation outlines various tips how to increase your TUFLOW HPC simulation speed.
TUFLOW - Info
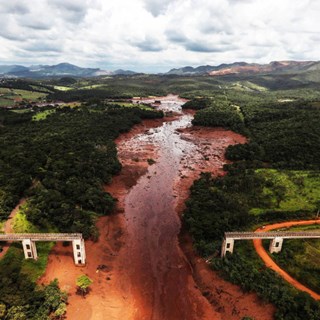
Modelling the 2019 Brumadinho Tailings Dam Failure with TUFLOW HPC's Non-Newtonian Fluid Functionality
TUFLOW - Info
CATCH is a new add-on module for both TUFLOW HPC and TUFLOW FV. It enables constituent (e.g. sediment, nutrients, pollutants, pathogens) generation, transport and intervention / mitigation features in the catchment. It also automates boundary condition information transfer between TUFLOW HPC to TUFLOW FV for fully integrated catchment and 3D receiving water modelling. Click here to learn more.
TUFLOW - Info
To solve environmental problems in our rivers, lakes, estuaries and coastal waters, hydrodynamic models rely on a range of boundary condition forcings. For a complex model, there may be hundreds of necessary boundary conditions, each requiring input data for multiple parameters.