In this article, TUFLOW HPC's non-Newtonian fluid capability is applied to the tailings dam failure and resulting mudflow that occurred in Brumadinho, Brazil in 2019
6 May 2021
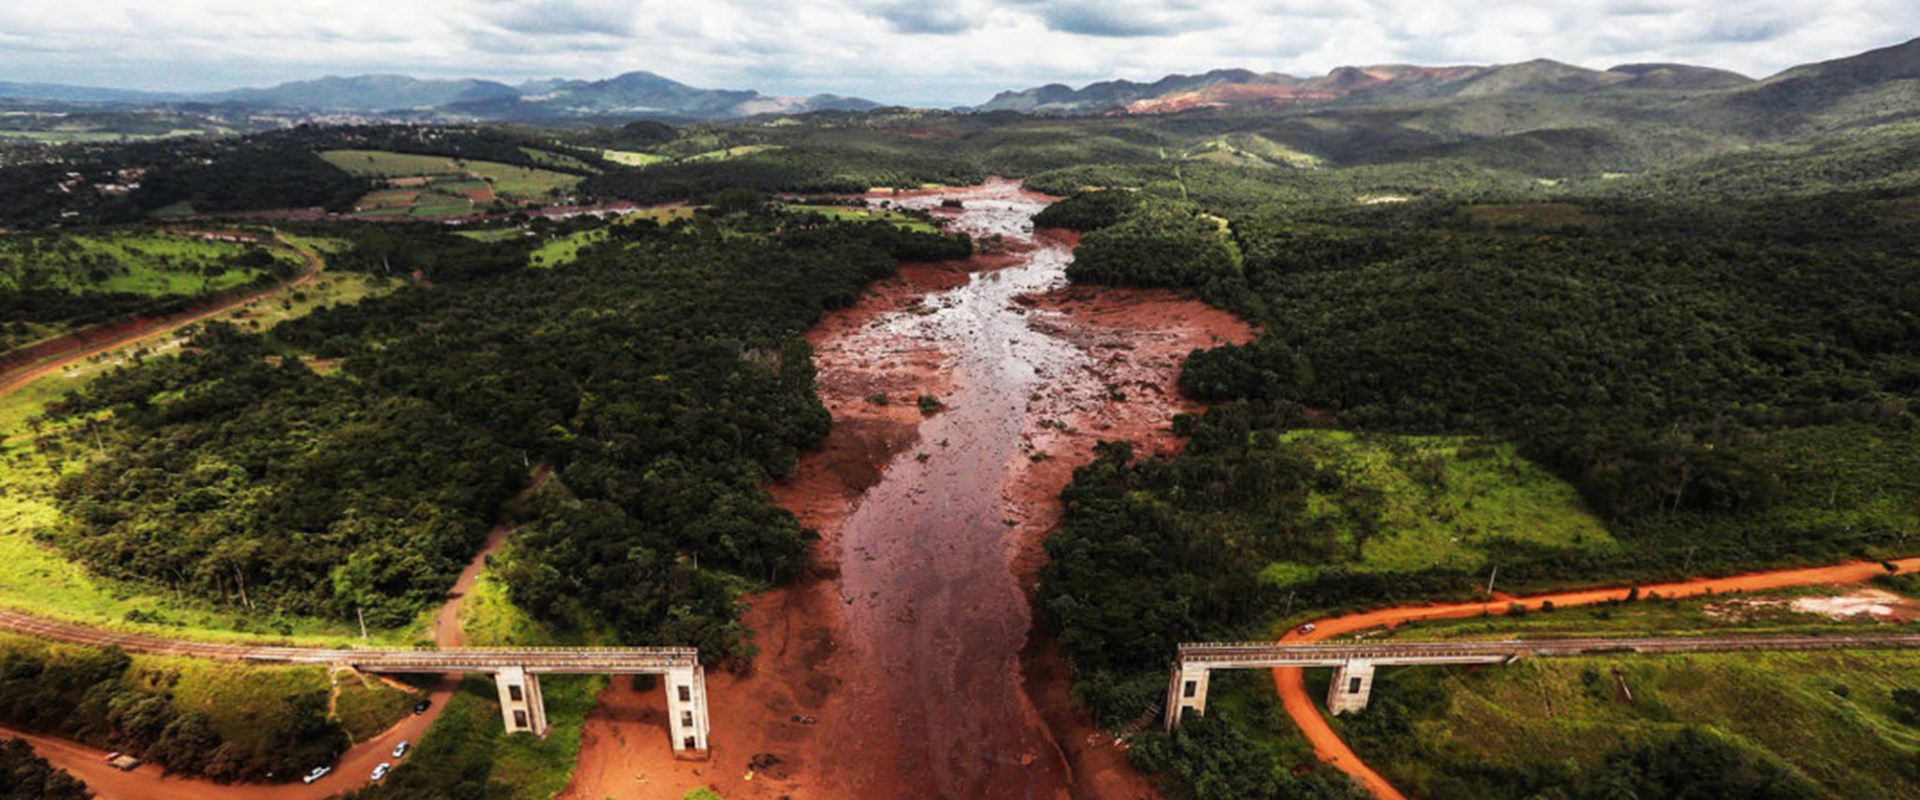
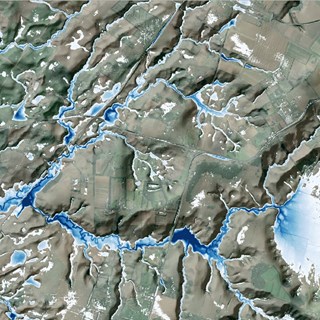
On the 25th January 2019, the Brumadinho tailings dam at the Cόrrego do Feijão iron ore mine in Brazil was subject to catastrophic failure releasing 10 million m3 of mining waste in around 5 minutes resulting in a mudflow wave killing 259 people with a further 11 reported missing. The collapse occurred just after noon with the resulting mud flow taking 3 hours to reach the downstream Paraopeba river some 9 km downstream. The images below show satellite imagery before and after the failure with the after image showing the mudflow extending throughout the valley from the tailings dam to the Paraopeba river.
The waste materials from mining operations, termed tailings, are often stored within the mine premises behind embankments of earth, which can often be loose constructions. These tailings are often a mix of grain size distributions that are usually deposited in a slurry form. When subject to forces, the tailings liquefy and begin to behave as non-Newtonian fluids.
Fluids such as water are known as Newtonian fluids have a constant viscosity, independent of stress. With non-Newtonian fluids, the viscosity can change when under force. A non-Newtonian fluid can become more liquid (shear thinning) or more solid (shear thickening). For Newtonian fluids, viscous (shear) stresses are linearly correlated to the local shear rate whereas non-Newtonian fluids portray a non-linear relationship.
High fidelity modelling of non-Newtonian fluids is inherently 3-dimensional and complex in nature. However, with a number of assumptions, it is possible to model non-Newtonian fluids in 2-dimensions (2D) and therefore can be modelled within a 2D hydrodynamic modelling software such as TUFLOW HPC. Turbulent eddy viscosity which is present and causes diffusion of momentum in Newtonian fluids, can be considered not significant in non-Newtonian fluids which are usually highly viscous and therefore the 2D viscosity can be computed using a viscosity model. This is particularly true for shear thickening fluids. For shear thinning fluids, the flow regime can become turbulent and additional turbulent shear stresses are generated which are represented with the standard TUFLOW HPC Wu turbulence model.
Newtonian fluids have a turbulent boundary layer that results in the velocity profile following the ‘law of the wall’. In the case of hydrodynamics, this is commonly determined via the use of the Manning’s equation. Non-Newtonian fluids do not portray the same turbulent vertical velocity profile. When the flow is in the laminar regime, the Manning’s bed friction is no longer applicable and instead bed friction is computed by a power law viscosity model and the depth-averaged flow velocity. As the flow becomes more turbulent, the Manning's bed friction becomes more applicable and starts to dominate relative to the non-Newtonian bed friction.
The final assumption is that acceleration effects are small and the fluid shear stress is linear with depth.
There are a number of viscosity models for non-Newtonian Fluids as shown in Figure 1 which includes the Newtonian model of a constant relationship between viscous stresses and shear stresses.
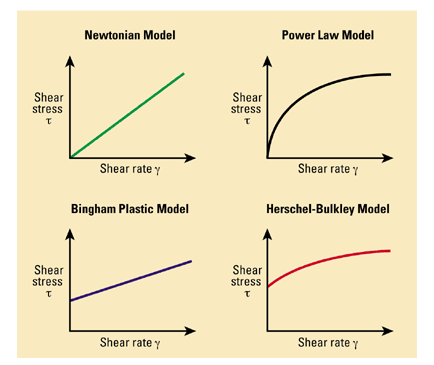
Figure 1: Common Viscosity Models for Non-Newtonian Fluids (image from the Schlumberger Oilfield Glossary (https://www.glossary.oilfield.slb.com/en/terms/h/herschel-bulkley_fluid))
TUFLOW HPC uses the Herschel-Bulkley model in which shear stress of the fluid is related to the shear rate in a non-linear manner. The Herschel-Bulkley corrects some of the deficiencies seen in the other commonly used power law and Bingham Plastic models by combining elements from them. This makes the Herschel-Bulkley model more generic and allows the modelling of shear thinning behaviour that tailing slurries can exhibit.
The Herschel-Bulkley equation is:-
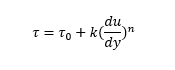
Where:-
τ is the shear yield stress
du/dy the shear strain rate related to a local u velocity
K is the Herschel-Bulkley viscosity coefficient.
n is a positive, non-zero, representing the degree of shear thinning/thickening. Using the Herschel-Bulkley equation with an n of 1 equates to the Bingham Plastic Model.
A TUFLOW HPC model was set up for the Brumadinho tailings dam failure event. The model geometry was based on an ALOS PALSAR RTC Digital Elevation Model (DEM) of the Brumadinho area from the NASA (Alaska Satellite Facility) which describes the terrain with a 12.5 m resolution.
The TUFLOW model, shown in Figure 2, covers an area of 12 km2 and utilises 115075 grid cells with a resolution of 10m. As shown in Figure 2, the model domain extends further than the observed mudflow extent so that the 2D boundary does not artificially control the simulated mudflow extents.
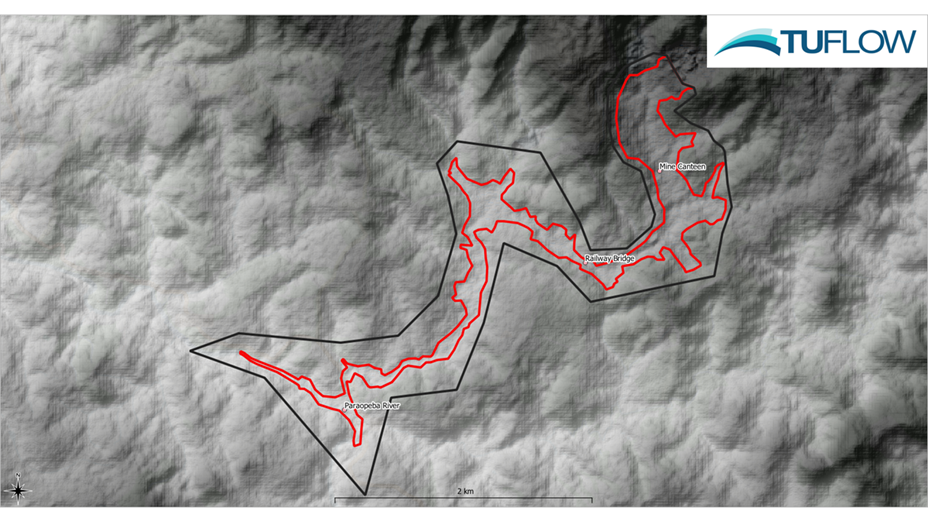
Figure 2: TUFLOW Brumadinho Tailings Dam Failure Model and Key Locations
The inflow representing the dam break was taken from Lumbroso et al., 2021, who used the EMBREA-MUD tailings dam breach model to determine the time-varying release of dam tailings following the collapse. The total hydrograph volume is 9.7 million m3 with a peak discharge of 90,000m3/s, subsiding to 0m3/s after 300s as per Figure 3.
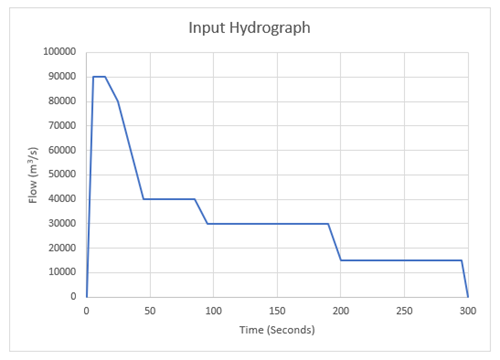
Figure 3: Inflow Hydrograph taken from Lumbroso et al., 2021 who utilised EMBREA-MUD to simulate the likely hydrograph from the tailings dam failure.
The Non-Newtonian parameters used were initially selected based on previous studies and then calibrated to observed extents and flood arrival times. A shear yield stress of 600 Pa, an n value of 1 and Herschel-Bulkley viscosity coefficient of 60 Pa sn was used after calibration of the parameters using the observed mudflow extent.
The model was run for a 4 hour period and took just over 3 minutes to run utilising a GeForce RTX2080ti GPU card.
Remotely sensed imagery, such as that shown at the start of this article, provides a maximum mudflow extent to which the modelled extents could be compared as shown in Figure 4. the TUFLOW simulated extent matches the observed extent very well, especially in terms of travel distance. Note, that since the acquisition of the DEM, there has been significant development of the mine site on the righthand side of the valley immediately downstream of the dam wall that is not represented in the DEM. As such there are a few locations in this region of development within the mine site where the observed extent extends further than the simulated extent. Modification of the model geometry in this location was considered but with no available more recent DEM information to base the modifications on, this was not undertaken.
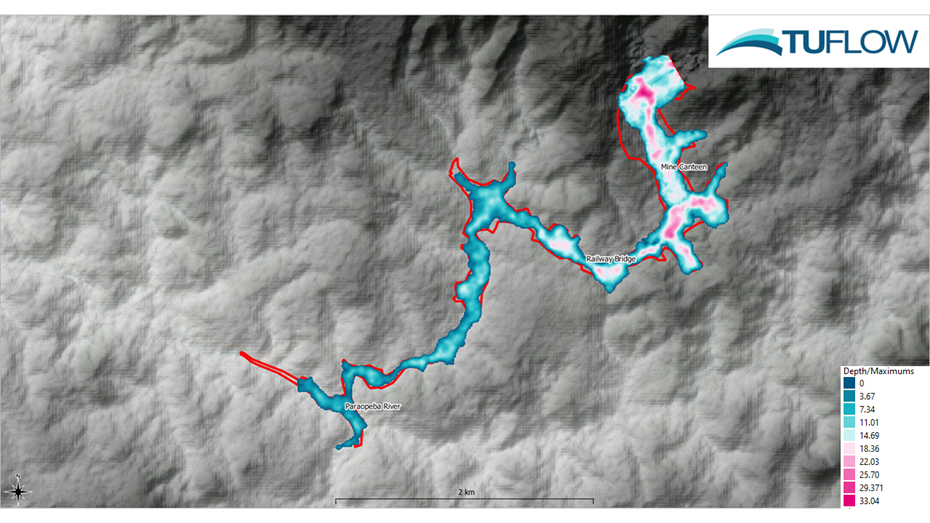
Figure 4: The Maximum Simulated Mudflow Extent Plotted Against the Observed Extent of the Mudflow
The Brumadinho tailings dam failure was caught on a number of videos during the event such as the below video of the dam failure.
From these videos the approximate travel time of the mudflow has subsequently been determined. Flood arrival time has been estimated at three locations by previous studies, and these are shown in Table 1, together with the TUFLOW HPC simulated arrival times. The locations of the various sites are shown in Figure 2.
| Description | Observed Arrival Time | Simulated Arrival Time in TUFLOW | Lumbroso et al., 2021 (MIKE 21) | Run Tc1 from Ligier, 2020 (Telemac) | Run Tc3 from Ligier, 2020 (Telemac) | Run M-a from Ligier, 2020 (MIKE21) | Run M-c from Ligier, 2020 (MIKE21) |
| Mine Canteen | ~2 minutes | 140 seconds | 90 seconds | 135 seconds | 135 seconds | 75 seconds | 120 seconds |
| Railway Bridge | ~10-12 minutes | 8.33 minutes | 9.16 minutes | 9.25 minutes | 9.5 minutes | 3.75 minutes | 7.25 minutes |
| Paraopeba River | ~1 hour 30 mins to 2 hour 10 mins | 1 hour 30 mins | 1 hour 26 mins | 2 hours 35 mins | 2 hours 55 mins | 1 hour 51 mins | 2 hours 40 mins |
Table 1: Observed and Simulated Mudflow Arrival Times for the Brumadinho Tailings Dam Failure (Results from Ligier, 2020 are from the reported Outflow Hydrograph Scenarios Only)
The TUFLOW HPC simulated arrival times match well with the observed arrival times and show a good correspondence compared to other studies utilising other software packages to simulate the non-Newtonian flows.
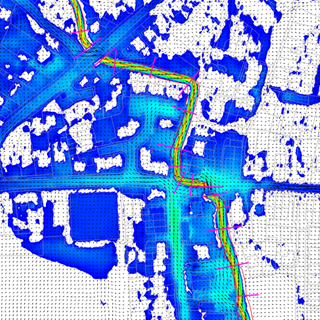
Information derived from videos of the event, suggest the maximum velocities could have been as high as 33m/s. Figure 5 shows the TUFLOW HPC simulated velocities with the maximum velocities peaking at approximately 28m/s.
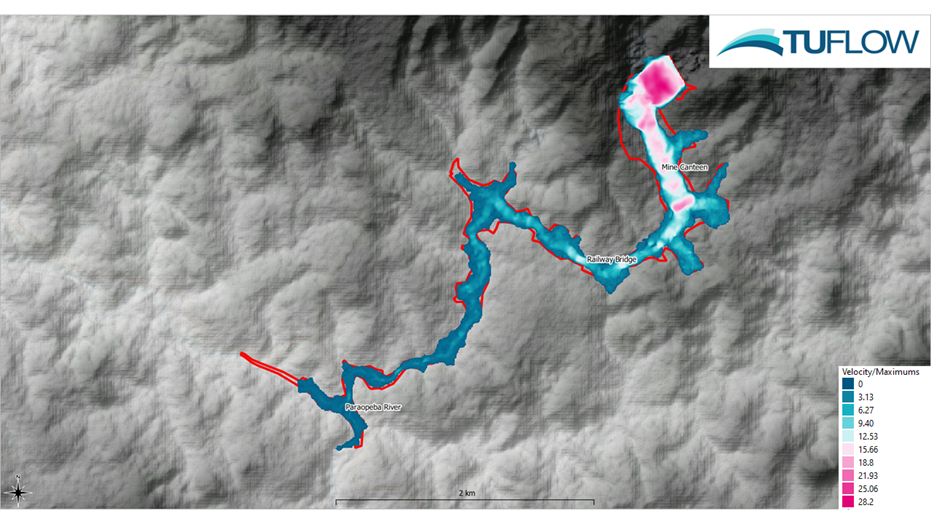
Figure 5: Simulated Maximum Velocities from the TUFLOW HPC Model
The 2020 release of TUFLOW HPC introduced functionality that allows the modelling of non-Newtonian fluids which behave differently to the water simulated within conventional flood models. The functionality has been tested on a well-publicised and catastrophic tailings dam failure from Brumadinho in Brazil in 2019. TUFLOW HPC provides a good correspondence with the observed flood extents, flood arrival times and estimated velocities and demonstrates the potential for TUFLOW HPC to assist in the risk assessment of tailings dams.
Ligier, P.L., (2020), Implementation of non-Newtonian rheological models in TELEMAC-2D in Online proceedings of the papers submitted to the 2020 TELEMAC-MASCARET User Conference.
Lumbroso, D., Davison, M., Body, R., and Petkovšek. G., (2021), Modelling the Brumadinho tailings dam failure, the subsequent loss of life and how it could have been reduced, Natural Hazards and Earth System Sciences, 21, pp 21–37.
Raman, A. and Liu, F., (2019), An investigation of the Brumadinho dam break with HEC RAS simulation, arXiv:1911.05219v1,[physics.comp-ph].
TUFLOW - Info
This benchmarking study assesses the performance of TUFLOW 2020 against a dam break test case using data from the Malpasset dam failure in France in 1959. The results show TUFLOW produces an excellent comparison with observed timings and water levels.
TUFLOW - Info
CATCH is a new add-on module for both TUFLOW HPC and TUFLOW FV. It enables constituent (e.g. sediment, nutrients, pollutants, pathogens) generation, transport and intervention / mitigation features in the catchment. It also automates boundary condition information transfer between TUFLOW HPC to TUFLOW FV for fully integrated catchment and 3D receiving water modelling. Click here to learn more.
TUFLOW - Info
The Pix Brook Flood Study is a multi-stakeholder options and feasibility investigation needing an integrated catchment wide model. TUFLOW was chosen due to its ability to represent surface water, fluvial and pipe networks within the one modelling software.

TUFLOW - Info
This insight explores recent TUFLOW FV speed benchmarking conducted by the team at TUFLOW achieving speeds up over 100x.