29 March 2019
Our aim at TUFLOW is to have the most accurate and robust hydrodynamic engines available. To ensure we achieve this, we are constantly testing the software with a wide range of benchmarking test cases. As well as in-house benchmarking, TUFLOW has been independently benchmarked by third-parties, which we publish in our library. The benchmarking assists us in ensuring we create the most accurate and robust hydrodynamic solvers.
Benchmarking ranges in scale from: simple models that test against analytical solutions; laboratory scale test cases from which comparisons are made with the hydraulic measurements; to real-world models for which there exists quality recorded data from historical events such as floods and storm tides.
One of the more rigorous tests is the dambreak test such as that for Test 6A of the UK Environment Agency benchmark test (shown here). Dambreak tests are a tough test of a hydrodynamic solver as they feature complex hydraulics with a dambreak wave, including hydraulic jumps and highly transient flow with flow shifting from sub-critical to super-critical and back again. Test 6A of the Environment Agency benchmark study is a flume study. For obvious reasons, there isn’t many real-world dambreak test cases to benchmark against although the Malpasset dambreak is one such case.
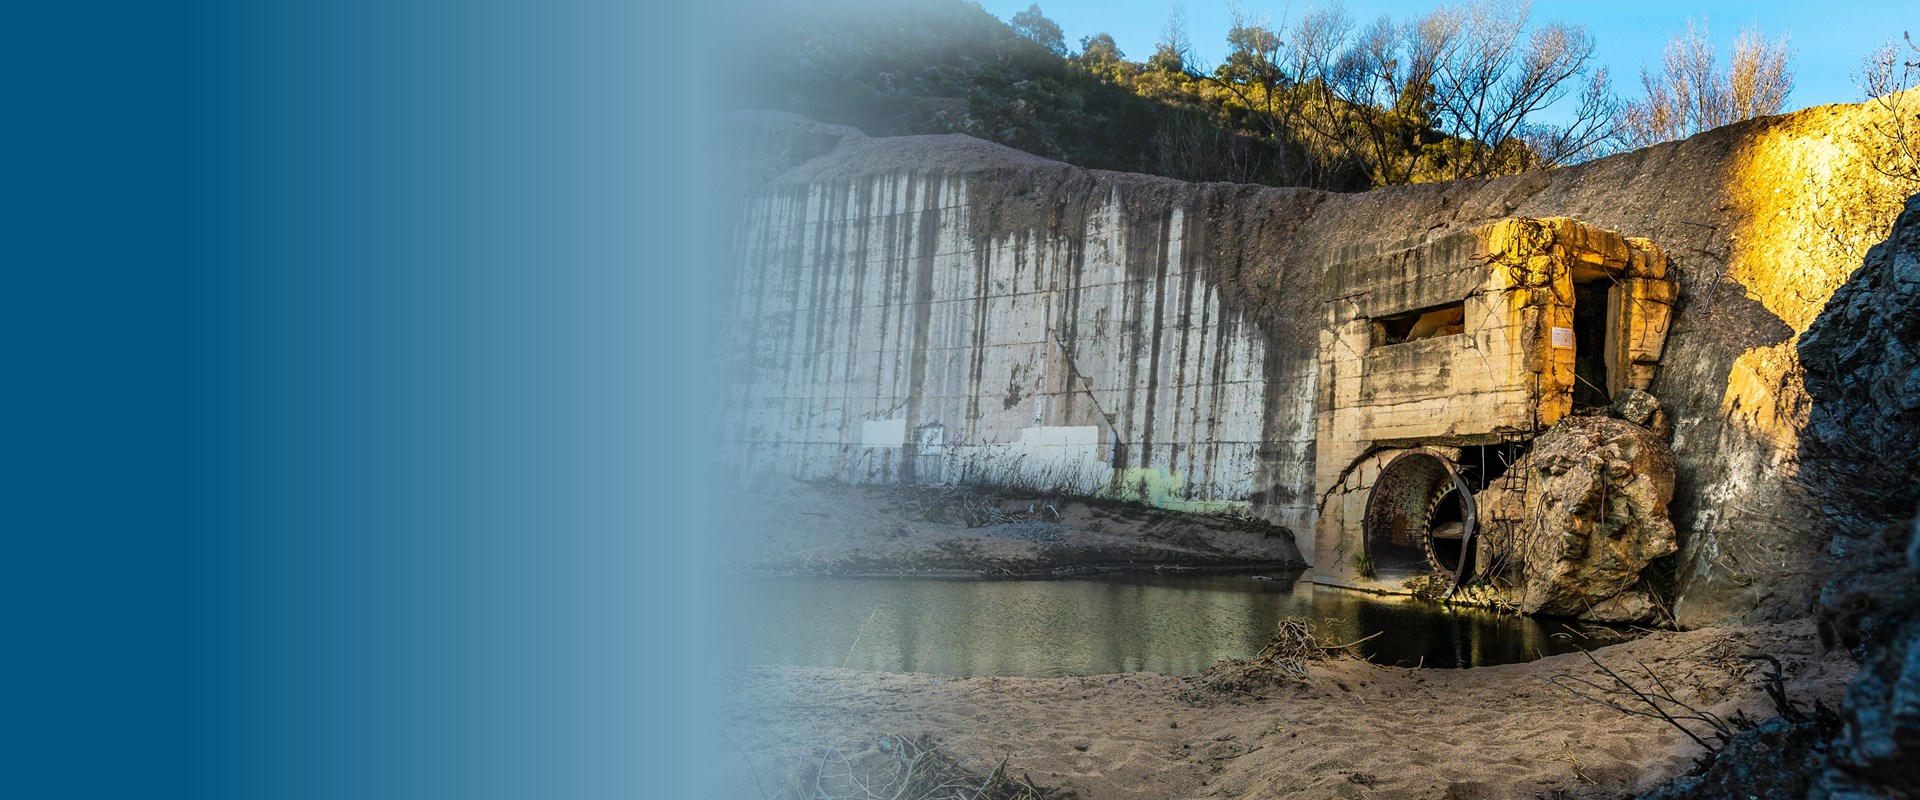
The Malpasset dam is a dam on Reyran River, approximately 12km upstream of Frehus on the French Riviera in the South of France. On December 2nd 1959, the Malpasset Dam failed resulting in a wall of water cascading downstream through a narrow gorge before spreading out onto the downstream floodplain close to the Mediterranean. In total 433 lives were lost, an estimated $60 million of damage and the assessment of dams in France was subsequently reviewed and improved.
The Malpasset dambreak has been well-studied since the events of 1959 with propagation times of the flood wave taken from the electrical shutdown at 3 electric transformers destroyed by the flood wave, observations of high water marks taken in the aftermath, and a physical model to replicate the dambreak as part of further investigations into the tragedy. The Malpasset dambreak is a unique example of the total failure of an arch dam. The collated data from the aftermath of the event provides an excellent opportunity for validating hydrodynamic modelling software to assist in the emergency planning in future dambreak situations.
A non-distorted flume model was built in 1964 and calibrated against observations. The flume model consisted of 14 gauges of which 5 were in the location of the upstream reservoir and 9 were in the downstream area inundated by the flood wave. Measurements of flood wave arrival and maximum water levels were taken at each of the downstream gauges.
Using a 20m Digital Terrain Model (DTM) derived from topographic data held before the event and a Manning’s n value of 0.03 a TUFLOW HPC model was generated consisting of just under 130,000 cells to represent the inundated area. The initial water level at the dam was set to an assumed upstream water level in the reservoir of 100 m AD. The model was run for 4 hours of real time, which took less than 3 minutes using an Nvidia GeForce GTX 1050 GPU card. The latest version of TUFLOW, the 2020 version was used for this benchmarking.
Figure 1 shows the model domain and TUFLOW Grid. Once simulated, model results were obtained from the point locations also shown in the Figure for comparison with observed data.
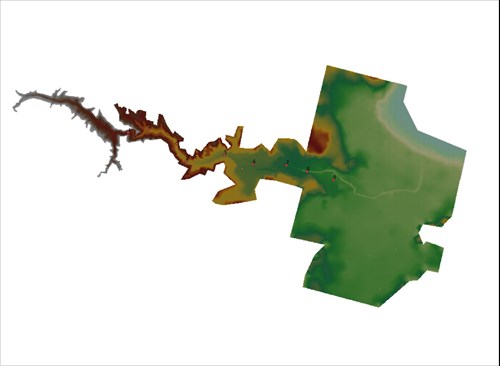
Figure 1: TUFLOW Model Domain for the Malpasset Dambreak Benchmarking Test
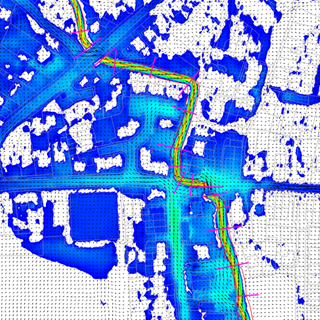
The following screenshots show the passage of the dambreak flood wave over a 40-minute period. The flow is initially contained in the reservoir before flowing down the narrow valley prior to spreading out onto the coastal floodplain at approximately the 20 minutes mark.
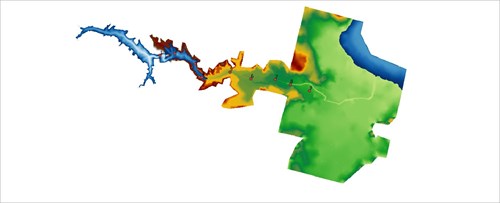
Figure 2: Malpasset Flood Wave at T=0 Minutes
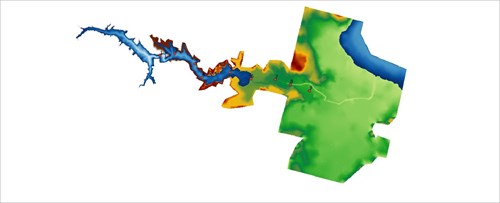
Figure 3: Malpasset Flood Wave at T=10 Minutes
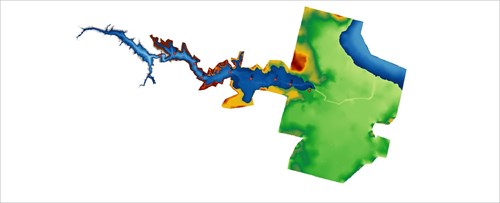
Figure 4: Malpasset Flood Wave at T=20 Minutes
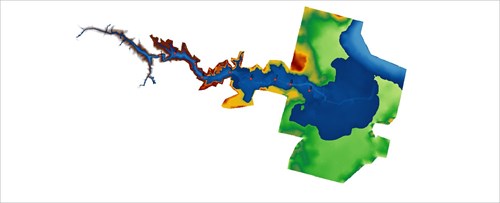
Figure 5: Malpasset Flood Wave at T=40 Minutes
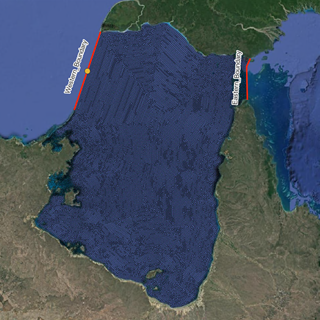
After the event, the French Police undertook a survey of high-water marks. These are located within the central part of the model domain within an incised valley. Figure 6 shows the location of those high-water survey locations together with the maximum flood extent.
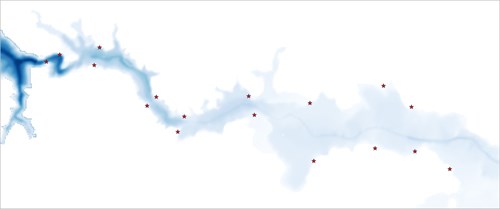
Figure 6: Location of High Water Survey Locations and Simulated Maximum Flood Extent
The timing of the simulated and observed flood waves at the 9 gauging stations downstream of the Malpasset reservoir shows an excellent fit (Figure 7) considering the 3D processes that would take place with a dambreak event of this type.
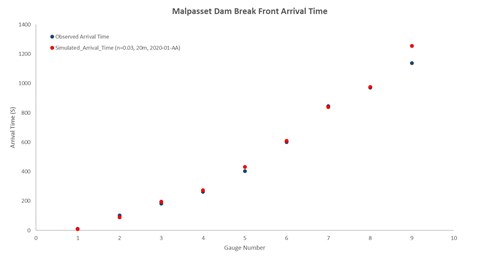
Figure 7: Observed and Simulated Flood Wave Arrivals Times
During the event, 3 electrical transformers at 3 hydroelectric plants (shown in Figure 8) were hit by the flood wave and the electrical shutdown can be used as a proxy for the propagation time of the flood wave.
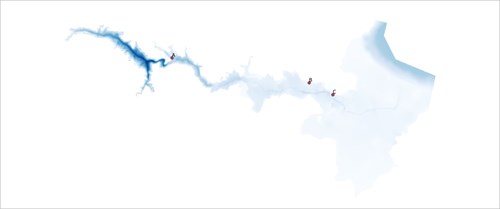
Figure 8: Location of Electrical Transformer Shutdowns
|
Electrical Transformer |
Arrival Time (s) Recorded |
Arrival Time (s) Simulated |
|
A |
100s |
96s |
|
B |
1204s |
1104s |
|
C |
1420s |
1233s |
A similar correspondence between the simulated and observed water levels obtained from measurements made in a flume scaled replication of the event was are presented in Figure 9.
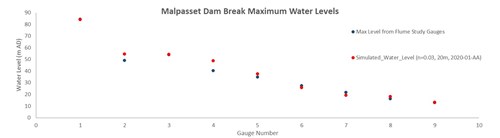
Figure 9: Observed and Simulated Maximum Water Levels
This benchmarking study assesses the performance of TUFLOW 2020 against a dambreak test case using data from the Malpasset dam failure in France in 1959. The results show that TUFLOW’s 2D solution presents an excellent comparison with observed timings and water levels. This is despite the strongly 3D processes that would occur during a dambreak. The use of the TUFLOW 2D solver provides accurate results within a timely manner and highlights TUFLOW’s accuracy and robustness as a hydrodynamic solver.
TUFLOW - Info
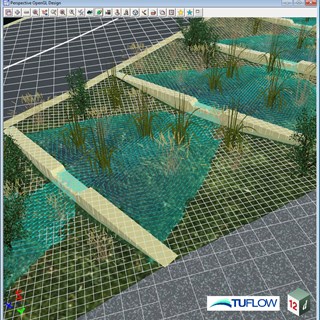
12d Model and TUFLOW provides an excellent way of integrating what were historically siloed areas of responsibility for civil designers, flood modellers and client liaison. This example showcases how 12d Model - TUFLOW can help customers overcome their problems in design and flooding projects by providing the connectivity from concept through to construction.
TUFLOW - Info
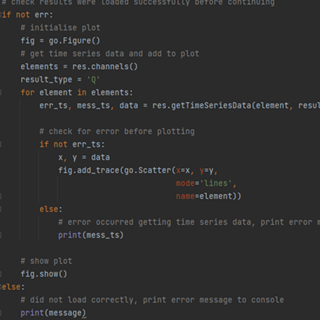
TUFLOW's PyTUFLOW toolbox provides an interface into the TUFLOW results file which allow the user to quickly and consistently process model outputs. An example is provided which integrates PyTUFLOW with the Plotly graphing library to produce interactive plots comparing modelled outputs with observed flow measurements.
TUFLOW - Info
The Pix Brook Flood Study is a multi-stakeholder options and feasibility investigation needing an integrated catchment wide model. TUFLOW was chosen due to its ability to represent surface water, fluvial and pipe networks within the one modelling software.
TUFLOW - Info
To solve environmental problems in our rivers, lakes, estuaries and coastal waters, hydrodynamic models rely on a range of boundary condition forcings. For a complex model, there may be hundreds of necessary boundary conditions, each requiring input data for multiple parameters.