The 2020-01 release of TUFLOW saw a host of exciting and ground-breaking functionality released including Quadtree, a grid-independent turbulence scheme and a sub-grid sampling approach. The latter of these, sub-grid sampling, and specifically its applications and its benefits, is the focus of this article.
20 May 2020
The 2020 release of TUFLOW saw a host of exciting and ground-breaking functionality released including quadtree, a grid-independent turbulence scheme and a sub-grid sampling approach. The latter of these, sub-grid sampling, and specifically its applications and its benefits, is the focus of this article. Further information regarding the sub-grid sampling approach and benchmarking are shown in the conference presentations highlighted in the references section at the bottom of this article.
LiDAR data, whether obtained aerially or terrestrially, is now available in increasingly high resolution. Within England, openly available LiDAR data covers around ¾ of the country with a resolution of 2m or finer. Despite the availability of such rich high-resolution datasets, the vast majority of the information is not commonly used in hydraulic modelling.
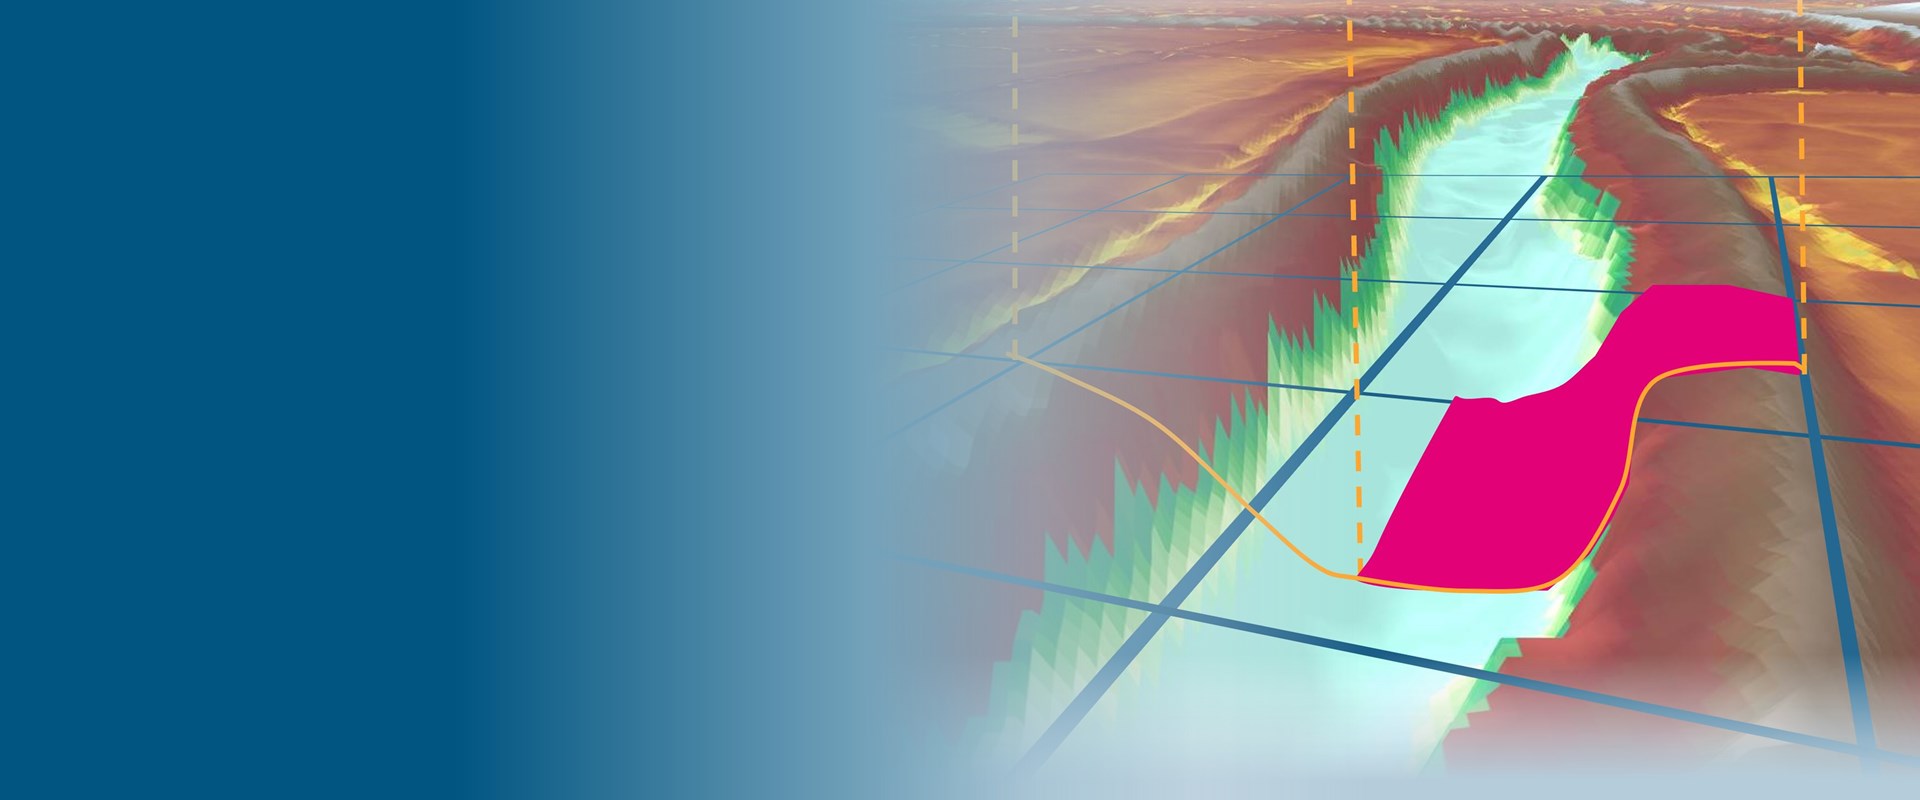
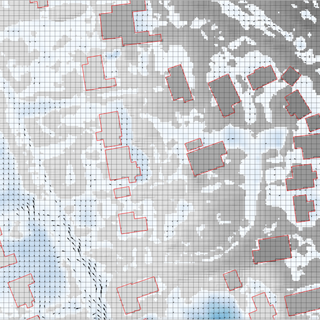
2-Dimensional (2D) hydraulic modelling software such as TUFLOW will usually sample the underlying digital terrain model (DTM) by taking the elevation at the cell centre (as well as cell faces in TUFLOW’s case) or taking an average/minimum of the underlying DTM elevations as the cell elevation. 2D hydraulic model grid cell sizes are typically of the order of 2-10 times the size of available DTM cell sizes. Therefore, the sub-grid scale topography that may be present in the DTM is not utilised within the 2D hydraulic model. Figure 1 shows a 20m grid on top of a 1m DTM. In this case, high resolution bathymetry is also available within the open channel. As can be seen in the image, and in the 3D view in Figure 2, there are only 2-3 grid cells across the width of the river channel, and fewer in some of the floodplain channels and road embankment. Taking a single value at the centroid of each grid cell will likely mis-represent the topography of the river channel, floodplain drains and embankments. Whilst TUFLOW’s powerful breakline topography functions will largely compensate for features such as the road embankment, the single elevation per cell side could provide a poor representation of the in-bank main channel conveyance topography.
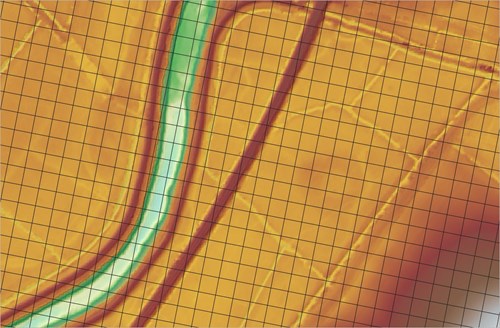
Figure 1: 20m grid size shown against the 1m DTM.
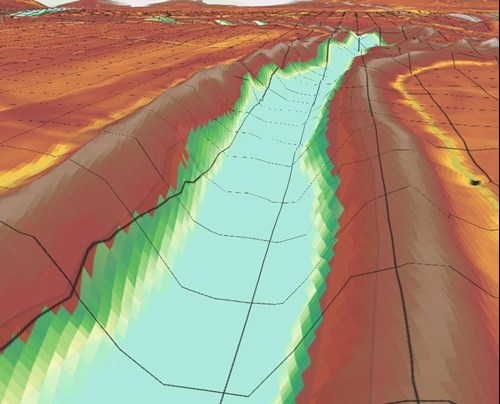
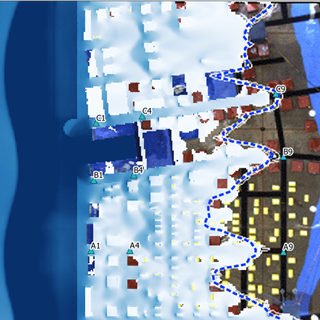
Figure 2: 3D View of the 20m grid size shown against the 1m Bathymetry and LiDAR Data.
An improved representation of detail within open channels is one of the reasons that we may tend to represent open channels using 1D hydraulic modelling or utilise flexible meshes, both of which are significantly more time-consuming to set up correctly compared to a regular fixed grid.
With sub-grid sampling, rather than using a single elevation value for the grid cell elevation, the underlying DTM cell elevations can be used to determine a water surface elevation vs volume relationship for each grid cell. Similar is performed along the cell faces, using the full topography across the cell face to generate water surface elevation vs width (or wetted perimeter) relationships to represent fluxes between adjacent cells. The result is that despite the hydraulic model grid resolution, the full array of information in the DTM is still being utilised within the 2D hydraulic modelling improving the representation of the underlying topography and accuracy of simulated results.
By utilising the underlying sub-grid scale topography, it is possible to more accurately represent the storage and conveyance that is possible within the system being modelled. A good example is when modelling a river channel with a coarse grid cell size. In the below example, a river-floodplain system is being modelled with a fixed 2D grid cell size. Due to the use of a single elevation being assigned to the grid cell, the conveyance and storage within the channel is being poorly represented with flow along the channel choked and constrained by the inappropriate 2D resolution. Therefore the flow spills out onto the wider floodplain as shown in Figure 3.
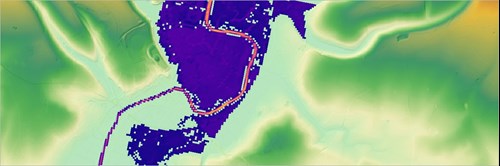
Figure 3: River Model Using a 20m Grid Cell Size.
If exactly the same model is run, but this time utilising sub-grid sampling, the river channel bathymetry and therefore the storage available within the channel is more accurately represented. The consequence is that the flow, which in this case is close to the mean daily flow, stays within the confines of the river banks as shown in Figure 4.

Figure 4: River Model Using a 20m Grid Cell Size using Sub-Grid Sampling.
If the simulation is conducted using Quadtree nesting of the grid cell sizes, with a 5m grid resolution in the river channel, we can see in Figure 5, that the 20m SGS run better represents that of a higher resolution simulation. A very similar output is provided when modelling the channel using a 1D schematisation, however the model build process is significantly longer when schematising the 1D network and the full 2D hydraulic interaction between the main channel and floodplain is not represented.
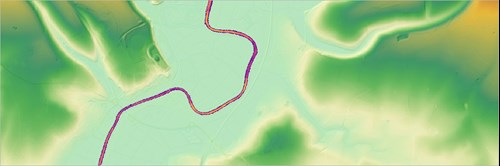
Figure 5: River Model Using a Quadtree mesh with 20m Grid Cell Size on the Floodplain and 5m in the Channel.
In terms of run times, the 20m SGS simulation was just over 5 times quicker than the Quadtree simulation. Even if river channels are represented within 1D, sub-grid sampling will help in the representation of floodplain channels, ditches, drains and other natural or artificial drainage systems that may be present within a catchment.
The use of sub-grid sampling can also assist with model calibration, and is particularly useful for whole of catchment direct rainfall models. Figure 6 shows some outputs from a whole of catchment TUFLOW model comparing simulated flow at two gauges with observed flow. The model has been run with 4 different grid cell sizes ranging from 2m to 20m both with and without sub-grid sampling.
As is expected, as the cell sizes reduces to the DTM size, the accuracy of our outputs improve and the results converge upon the observed flow. However, the simulated results are clearly sensitive to the grid size being used. This means that if a model using a 20m grid size is calibrated to match the observed data, the calibration is then not applicable to any other grid cell sizes without further calibration.
However, if sub-grid sampling is used, as shown in the lower set of graphs, it can be seen that there is a much closer correspondence of the simulated outputs to each other that is barely visible at the scale of the image. The prime reason is due to the representation of all the sub-grid scale topography present within the DTM using the sub-grid sampling approach. The use of sub-grid sampling effectively eliminates sensitivity to mesh size, which is a major issue within the 2D modelling industry where coarse 2D cell sizes are used.
Further research, which will be available in peer reviewed conference papers in the coming months, provides evidence from the wide range of benchmarking carried out from flume-scale tests to large river scale calibrations to whole of catchment models, that sub-grid sampling virtually eliminates the sensitivity of results to grid cell resolution and grid orientation, up to the point where coarse cell sizes simply cannot resolve the underlying hydraulics.
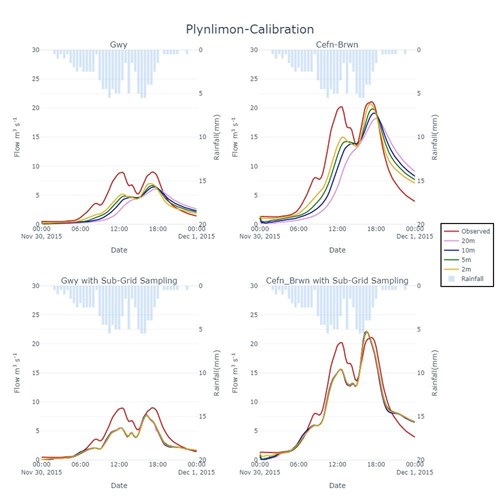
Figure 6: Comparison of Simulated Flow versus Calibrated Flow within a Direct Rainfall Whole of Catchment Model at two Gauge Locations for a Range of Grid Cell Sizes. The top graphs show the comparison without using sub-grid sampling and show variation between the outputs from different grid sizes. The bottom graphs show the simulated flow using sub-grid sampling which despite the variation in grid cell size, shows consistent simulated outputs and demonstrates excellent grid cell size convergence.
The amazing benefit to modellers and workflow efficiency is that the modeller can calibrate a model and the calibration can still be valid when we change the grid resolution. Table 1 shows the run times for the various grid cell sizes. As can be seen the 20m grid cell size, when utilising sub-grid sampling, runs in just over 1% of the time of the 2m grid cell size with similar outputs. This opens the option of running multiple runs using a coarser resolution to undertake calibration, uncertainty analysis, continuous simulations, or even probabilistic modelling. Where a higher resolution hydraulic analysis is required for structure design, mapping velocities or flood hazards, or other detailed hydraulic and flood planning analyses, the cell size can subsequently be reduced across the model or by using a Quadtree mesh.
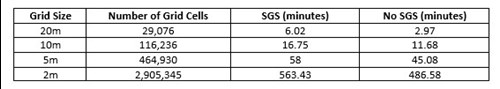
Table 1: Run Times for a Direct Rainfall Whole of Catchment Model for 30 hours Simulation Time.
The ability to run whole of catchment models, over long continuous simulations, has many applications and in the past, it has not been possible to run these due to computational constraints and the inability to demonstrate grid cell size convergence. Figure 7 shows the same 20m model run over a 3-week period to represent multiple rainfall events. This simulation was run in 102 minutes with a very good correspondence with the observed data.
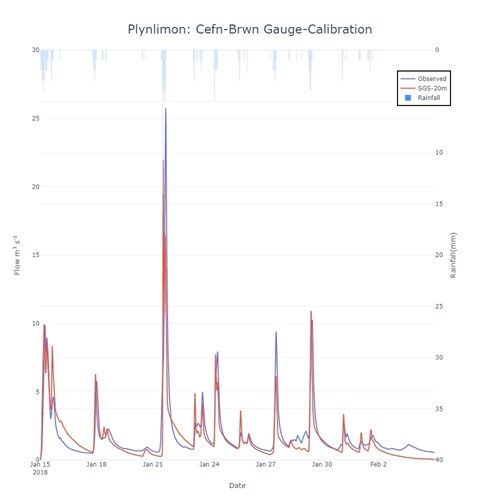
Figure 7: Simulated vs Observed Flow for Whole Catchment Model for a series of rainfall events between January 15th 2018 and February 4th 2018.
This type of whole catchment continuous simulation, will allow a robust analysis of distributed natural flood management (NFM) options to be undertaken, assessing the potential impact upon the phasing of individual tributaries as well as the effect of storing water over a series of flood events. Whole catchment modelling in a timely manner has the potential to be used as a digital twin of the real world catchment, allowing the testing of various NFM measures to be undertaken to determine the areas of the catchment where NFM measures will provide the most significant impact on the catchment flood hydrology.
Sub-grid sampling is a powerful feature that allows the modeller to utilise the high resolution DTM data regardless of the TUFLOW grid cell size being used. With most 2D hydrodynamic solvers, when showing grid cell size convergence, the smaller the grid cell size, the more accurate the underlying topography is represented and therefore the more accurate the results. However, this comes at a cost with run times many times longer than larger grid cell sizes. With sub-grid sampling, despite using larger grid cell sizes, the underlying topography is still utilised. Results using coarser grid cell sizes and sub-grid sampling are comparable to those using a much finer grid cell resolution at a fraction of the computational effort, and data storage. Results are also comparable to those obtained from 1D modelling or using a well-designed flexible mesh at a fraction of the model build effort and post-processing effort.
The rapid processing of simulations allows the use of hydraulic models during flood events in near real-time for the purpose of flood emergency planning. Sub-grid sampling can be utilised in conjunction with TUFLOW’s Quadtree solver to allow the user to focus detail where required without compromising computational efficiency in locations of little topographic variability. Sub-grid sampling can be used to ensure areas of coarser grid cell resolution, still providing the necessary detail for robust 2D hydraulic outputs. The use of sub-grid sampling, with or without Quadtree, opens up some exciting opportunities for whole catchment modelling, which can be important for understanding of NFM. Sub-grid sampling allows the modeller access to more accurate hydraulic results more quickly providing a real step change in the way we approach hydraulic modelling.
Syme (2020) "Recent Advancements in 2D Hydraulic Modelling", Water NZ Symposium
The bathymetry data was supplied by Maltby Land Surveys Ltd, where Environment Agency was the client, and the project was delivered by Team Van Oord (Royal HaskoningDHV and Mackley Construction). The LiDAR data used contains public sector information licensed under the Open Government Licence v3.0. The Plynlimon model contains data supplied by Natural Environment Research Council. The Plynlimon observed rain gauge and flow data was provided by the Centre of Hydrology, Bangor.
TUFLOW - Info
Sub-Grid Sampling opens up the door to offer major benefits to Urban Surface Water Modelling, particularly with regards the simulation of property flood depths, an important metric for flood risk management

TUFLOW - Info
A new version of PyTUFLOW has been released which extends the library's functionality from accessing 1D results to supporting 2D results as well as input side functions. This brings with exciting opportunities to programmatically interact with TUFLOW model build files.
TUFLOW - Info
Off the back of significant research and development as part of the hotly-anticipated 2020 TUFLOW release the TUFLOW team submitted two papers to IAHR's RiverFlow 2020 that were peer-reviewed and accepted for publication.
TUFLOW - Info
Shuang Gao, one of TUFLOW's leading developers and researchers, published and presented two papers at the (virtual) IAHR ADP Conference hosted from Japan